Last week in response to the current gubernatorial election issue of K-12 funding, I wrote about state revenue to the Grosse Pointe Public School System in both the Granholm and Snyder administrations. My take was not all that different from the non-partisan Citizens Research Council brief published a few days ago.
Here’s an abridged abstract of the CRC report:
“Is school funding up or down compared to four years ago?”
Here the answer is an unequivocal ‘up’. While total state funding is up over $1 billion from FY2011 to FY2015, the increase is almost exclusively earmarked to satisfy school employee retirement costs.
“Has education funding gone up as much as it could have?”
Here the answer is ‘no’. State tax policy and budget decisions effectively stretched the School Aid Fund.
“Are individual school districts better off today than they were four years ago?”
An answer to this question is far less definitive. While the amount of per-pupil funding is up, districts are paying higher retirement bills. This leaves fewer resources for other school expenses.
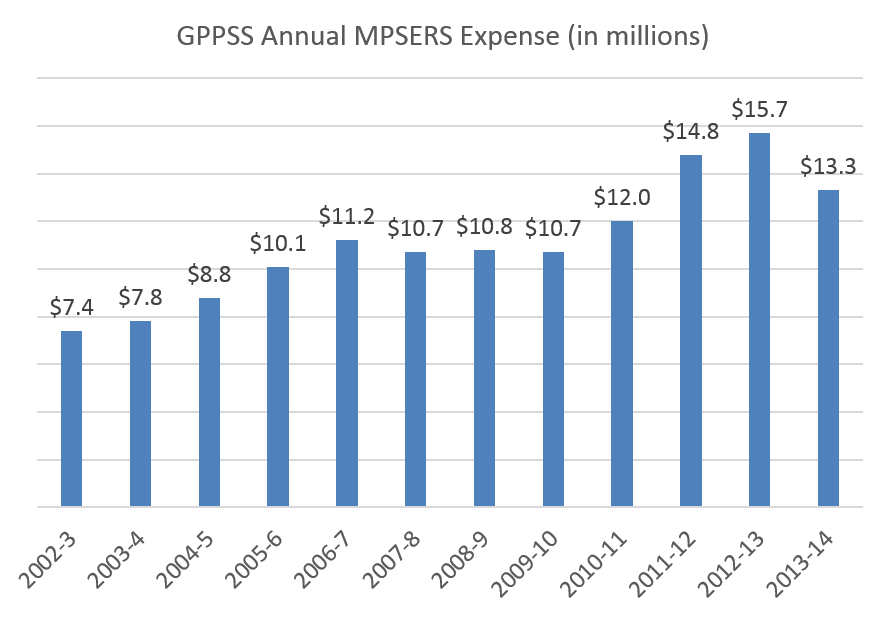
The third answer above is the key one. Let’s look at the GPPSS’ retirement cost trends over the last decade. This first chart paints the picture. From 2002-3 to 2012-13 the district’s retirement (MPSERS) expense more than doubled, from $7.4 million to $15.7 million.
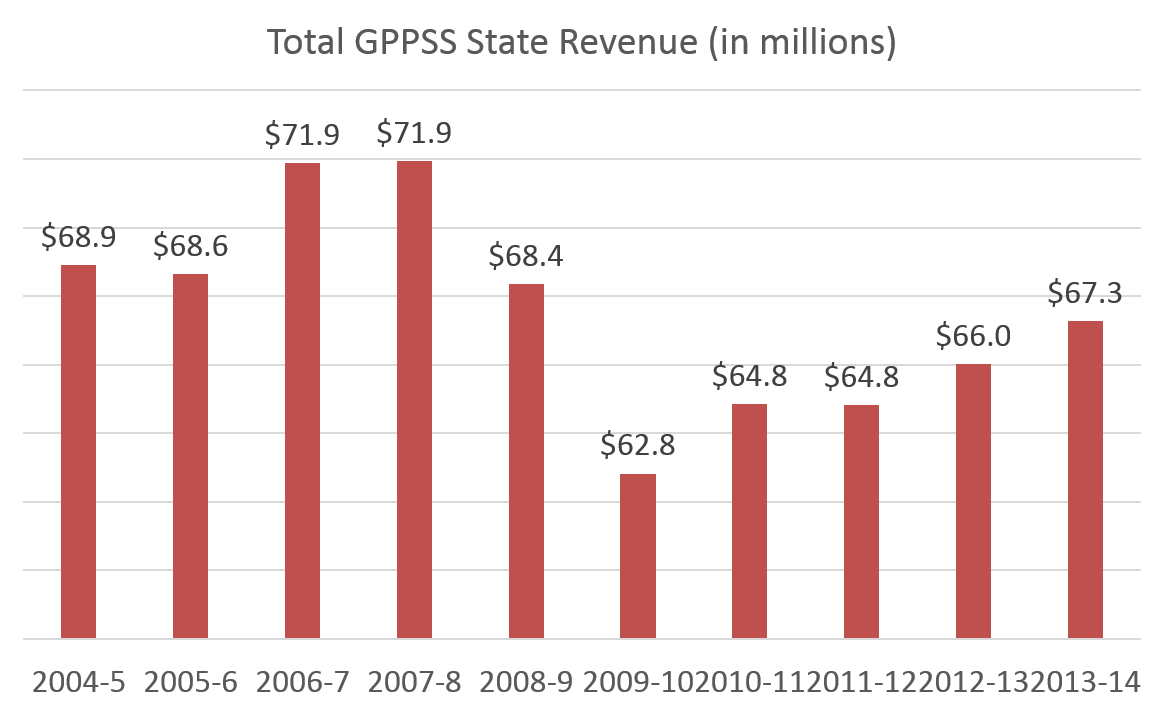
Over this same period of time, state revenues varied, but by 2012-13 it was $2.9 million lower than 2003-4. Throw in the $8.3 million increase in state mandated retirement costs over the same time and it created a $11.2 million budget problem. Recall that state revenue and state retirement costs are solely dictated by the state, entirely out of local control. All we get locally is the problem.
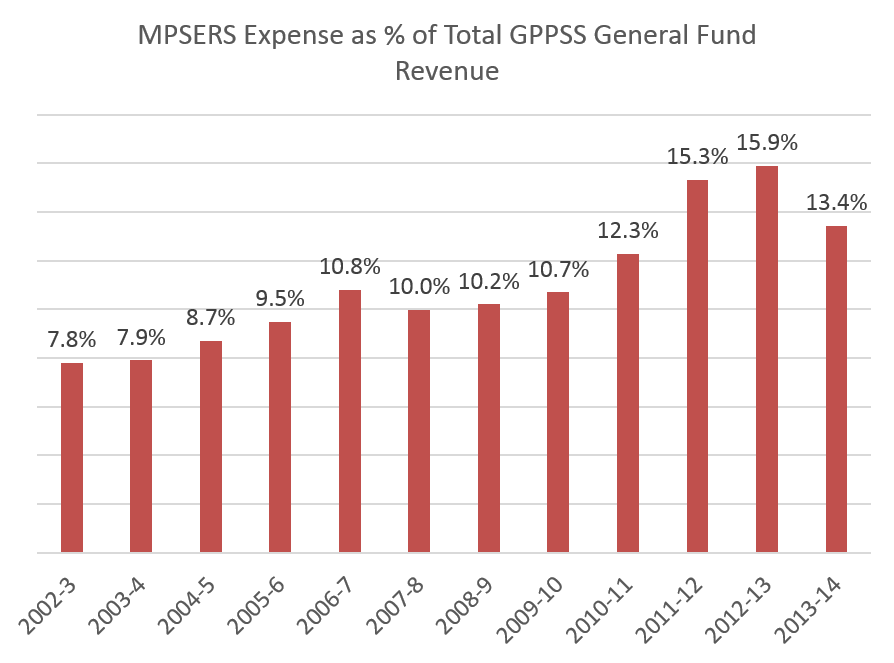
Taken as a percentage of the total General Fund budget, retirement costs (MPSERS) that had once consumed 7.8% of the budget in 2002-3 grew to consume 15.9% by 2012-13.
How did the district try to solve this problem? The shortest explanation is that jobs were slashed. In 2002, the district employed 1069 full time equivalent employees. By 2010, the district employed 852 – a reduction of 20% of our workforce – far outpacing the 7% reduction in enrollment.

So why the reduction in retirement costs in 2013-14 (as seen in the first chart above)?
That is the ultimate effect of the employee salary reductions of 3.4% in 2012-13 and 4.9% in 2013-14. Reducing salary cost is the only way to reduce retirement costs.
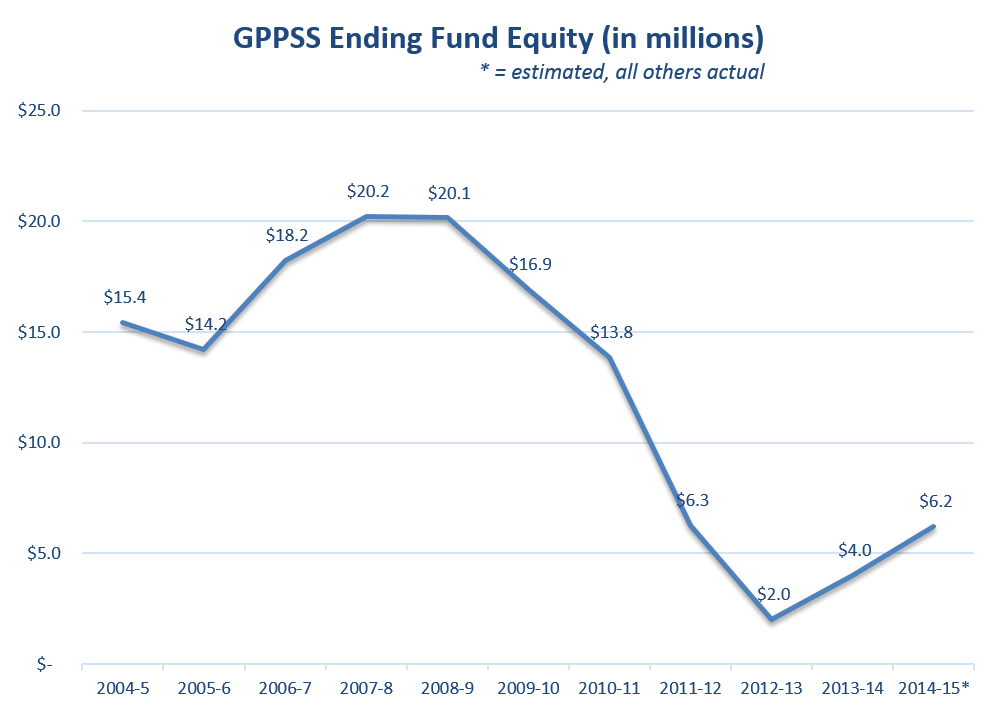
From 2007-8 to 2011-12, without the benefit of the contract formula, fund equity plummeted by $18 million despite that massive reduction of employees. After the contract formula took effect, the district started to run annual surpluses that will return fund equity to 10% by 2016-17. Meanwhile employment levels remained flat.
Reducing direct compensation costs via the contract formula was the only permanent means of fixing the problem created by the state funding mechanism and was crafted primarily to prevent the underfunded state retirement fund from destroying the Grosse Pointe Public School System.
2 responses to “Retirement costs in the GPPSS”
[…] The black bars represent shifts that work to preserve fund equity. Those total $30 million. The red bars work against fund equity. You see again the $30.4 million in lost revenue wipes out the total effect of the black bars (and then some). It’s the other four red bars that generated the vast majority of the $18 million drop in fund equity. The biggest culprit – again – is ever increasing retirement costs. (See recent post on retirement costs for more detail.) […]
[…] proposed SAF budget is at its highest level since 2005. The controversy surrounding whether this is a true increase is based on such an increasing percentage flowing to […]