The Grosse Pointe Public School System’s Board of Education meeting set off some fireworks last night (January 19) as a new configuration of a board – with a different majority – takes the helm.
The Board’s Budget Development Parameters tell the story. This resolution outlines the Board’s direction to the administration for the development of the 2023-24 budget which will be ratified at the end of June. Among them was direction to identify the potential for a $3 million cost reduction in the Support Services budget. So what does that mean?
Before getting into the weeds of defining Support Services (and we will) let’s review what probably prompted this directive.
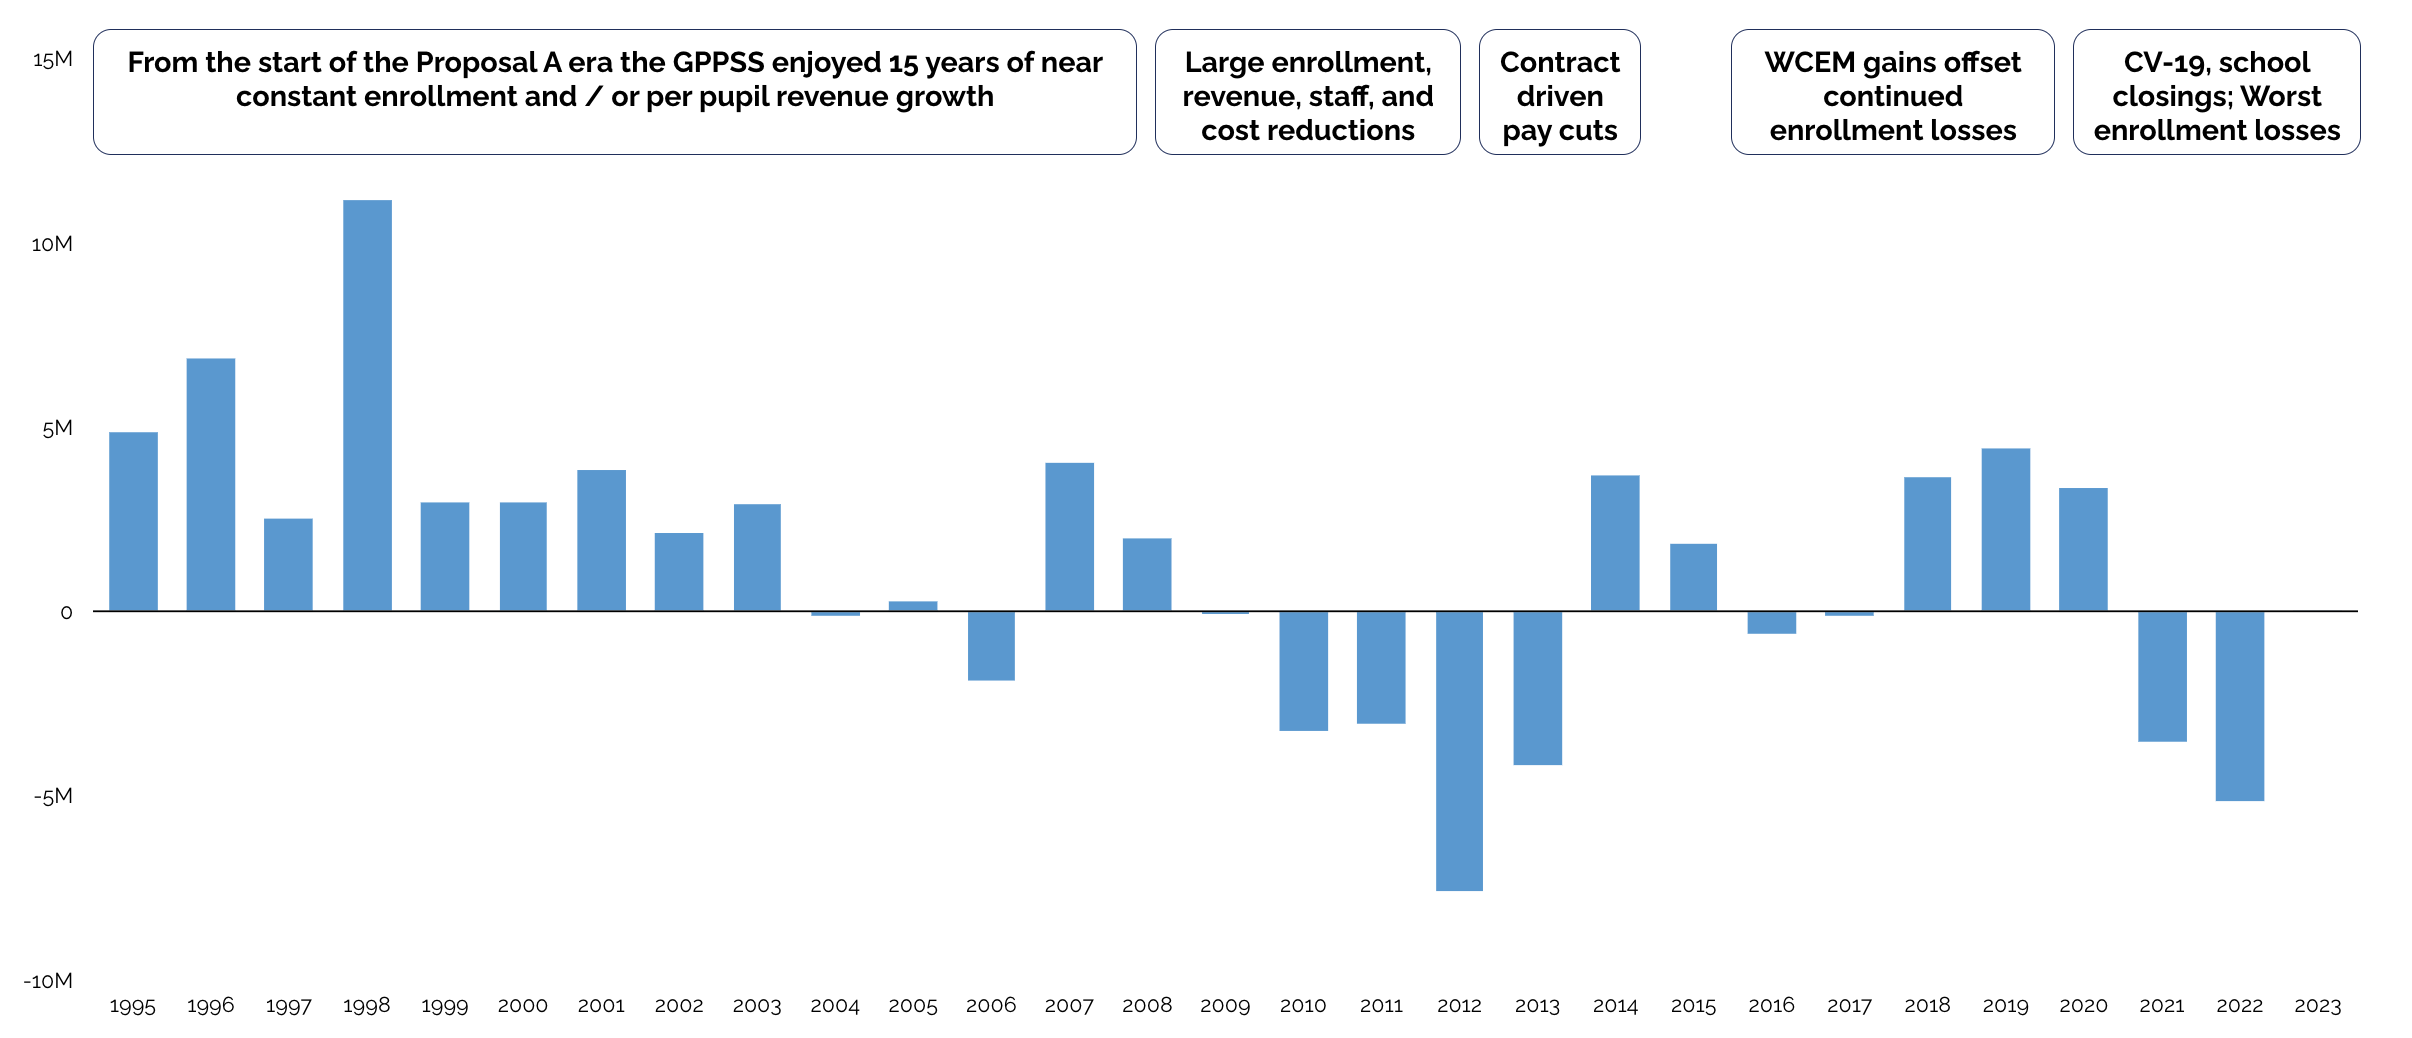
Pretty simple actually. For the last two years the GPPSS’ General Fund expenditures have surpassed revenues by $8.7 million. The 2020-21 loss of $3.5 million was followed by a $5.2 million loss last year. Let’s take a long view on this. Below are the district’s annual operating results (surplus or deficit) for every year since Proposal A passed.
Annual deficits reduce the district’s Fund Equity, which is now on the downslide.

Fund Equity stands at $9.7 million. It was $18.4 million two years ago. (The 2023 figure is projected in the current budget.) The $5.2 million loss of last year is the second worst annual result since 1995.
Those interested in this topic need to absorb this. Why is the district operating at an annual deficit? Very simple. Declining enrollment.
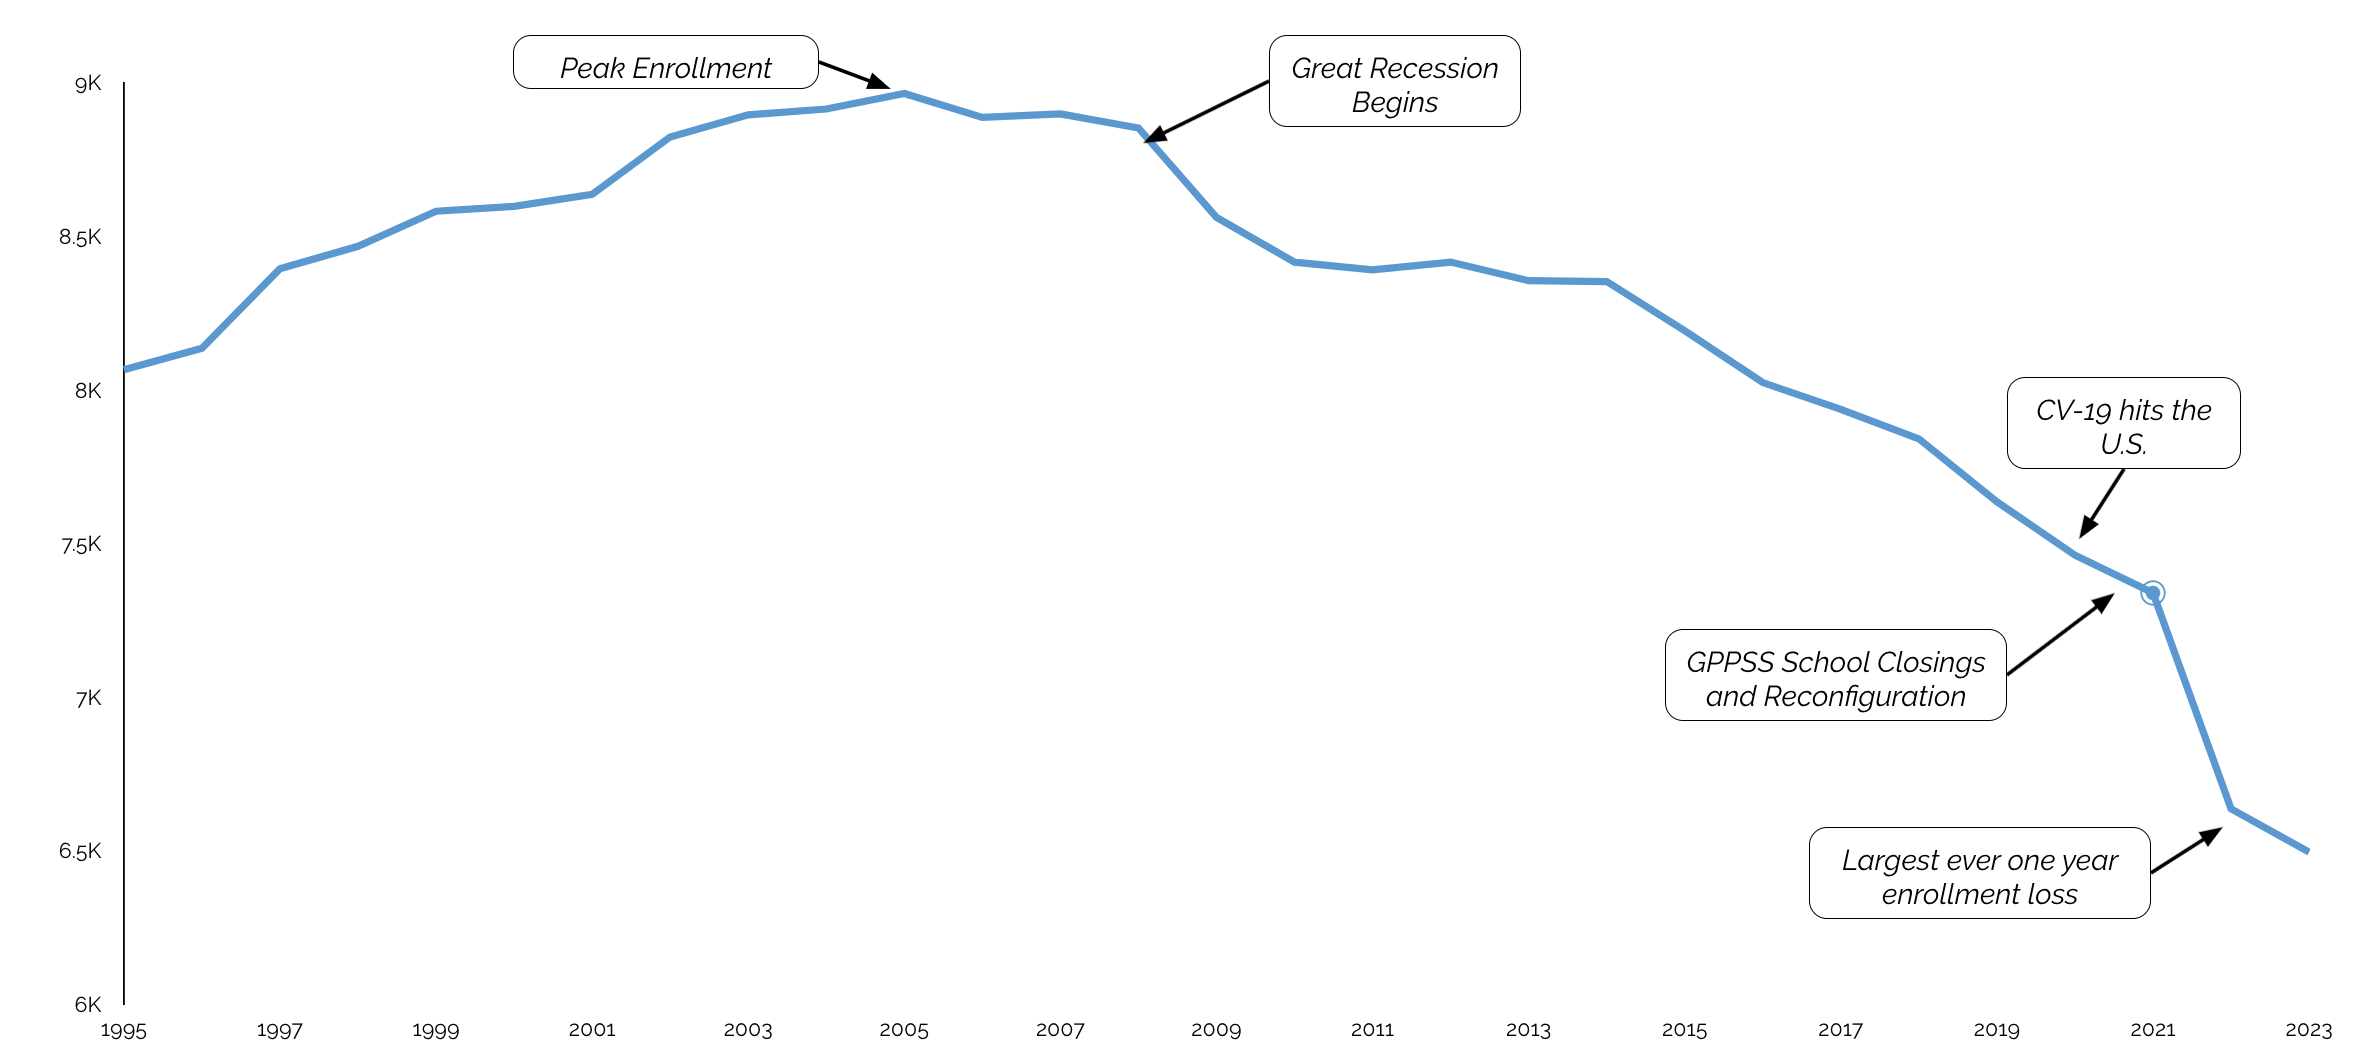
Last year was the largest loss of student enrollment in the Proposal A era and most certainly of all time. Enrollment is about 6,500 students now, 25% lower than 2005. And presumably we all know by now that Michigan funds school on an enrollment basis. Lose students, lose revenue.
And for further context, the district’s revenue per pupil (like many districts) has grown steadily from 2015. State tax revenues have never been higher and the Wayne County Enhancement Millage’s $3 million per year to the GPPSS was our manna from heaven.
Revenue per pupil has NOT been the problem (lately).
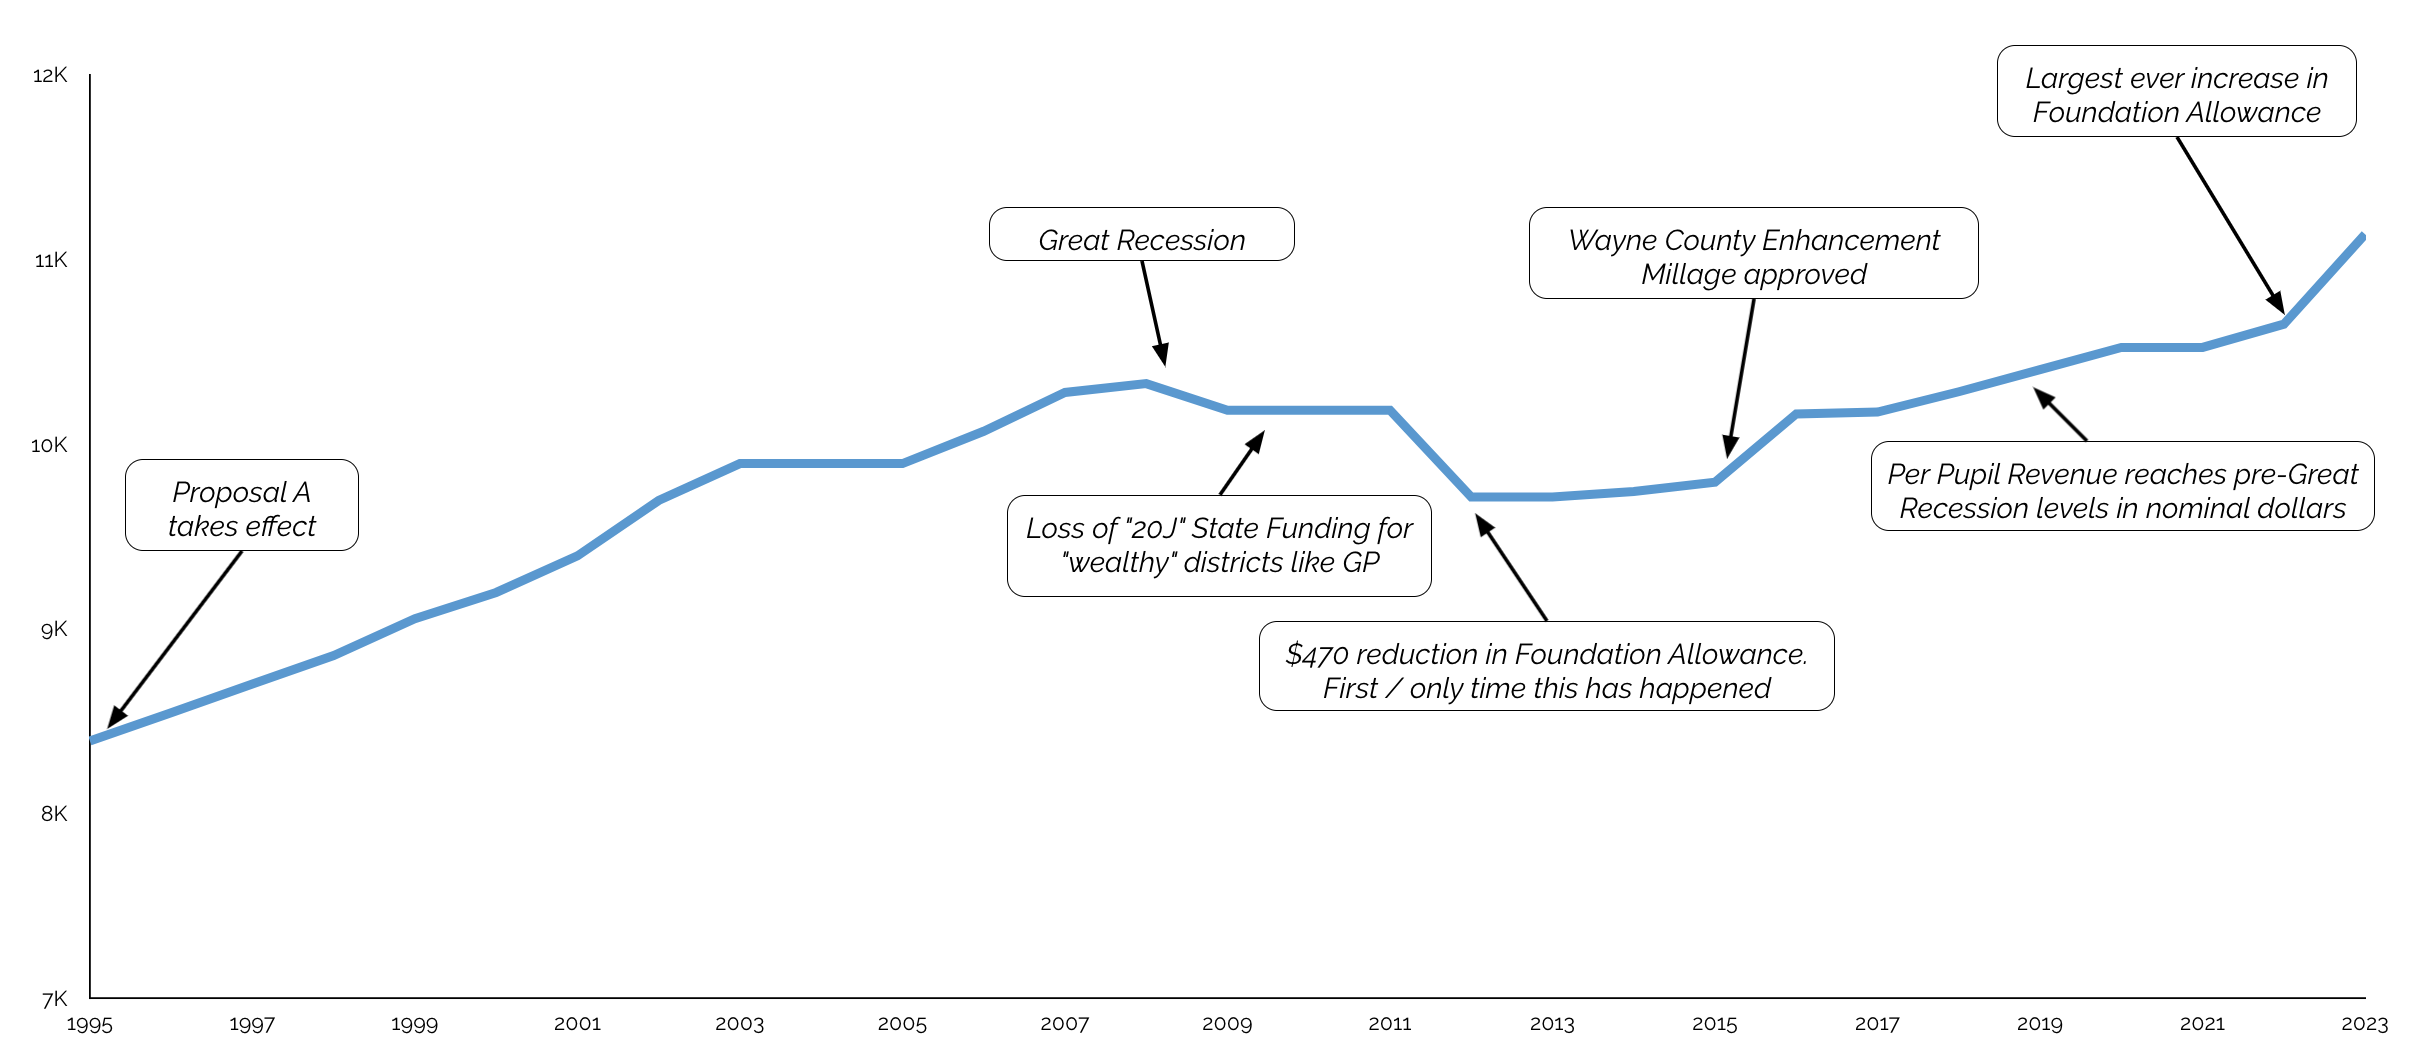
The problem is almost exclusively an enrollment loss problem – and barring the ability to change that trend it results in a spending problem. If we cannot bank on increasing overall revenue and we’re running deficits you simply must cut costs. No debate.
Now back to the Budget Development Parameter and the $3 million reduction in Support Services costs. With GPPSS running an average of $4.5 million of losses over the last two years, this tells us that even $3 million alone may not win the trick. But let’s leave that aside for a minute and get back to why Support Services was singled out.
Let’s get the terminology down. The data model below serves as a useful reference as we get our heads around Support Services.
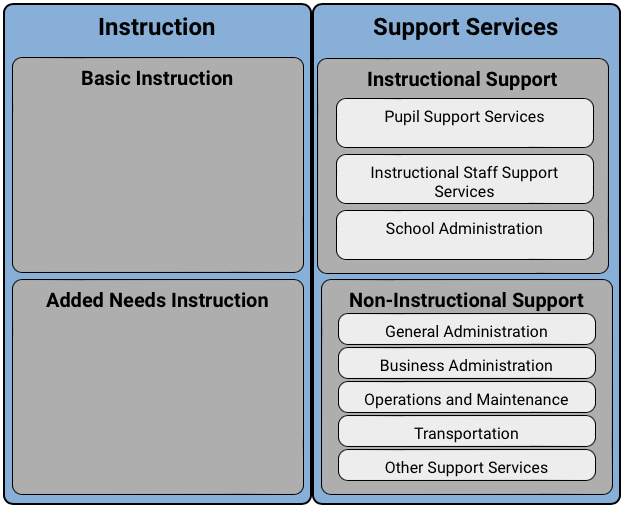
Every school district in Michigan organizes their expenditures in two categories – Instruction and Support Services. These two main buckets of expenditures can broken down further – firstly in the dark gray boxes and further yet in the light gray.
Basic Instruction and Added Needs Instruction roughly align with General Education and Added (or Special) Needs Instruction. So the district is saying, at least by this one parameter, that they are targeting cost reduction outside of General Education and Special Needs – which is mainly made up of teacher costs.
Support Services, as can be seen, has two main sub-categories (Instructional Support and Non-Instructional Support) and eight smaller ones. Some are self explanatory (Operations and Maintenance, Transportation) the rest a little nuanced.
- Pupil Support Services – attendance, guidance, health, and social workers
- Instructional Staff – teacher in-service, curriculum development, educational media services, program directors
- School Administration – those associated in general with the principal’s offices in the district school buildings (not central / general)
- General Administration – this is the office of the Superintendent and related direct costs
- Business Administration – costs for people and other for budgeting, accounting, payroll, purchasing
- Other Support Services – a classic “everything else” bucket that also includes IT staff
We now have a lay of the land for understanding budget categories. How do we assess if spending in and among them should be targeted for reduction?
This is its own complex topic, but the short version for me (after years of study) is to look at each district’s spend in each category (and sub-category) as a proportion (percentage) of the district’s total revenue. This normalizes the data enabling comparison among districts since districts come in all sizes and many have different revenues per pupil and many other complicating factors.
Let’s start at the state level and quantify statewide spend proportions. The below are the aggregated proportional spends of the state’s roughly total $17 billion spend on K-12 education. So this is a large data pool.
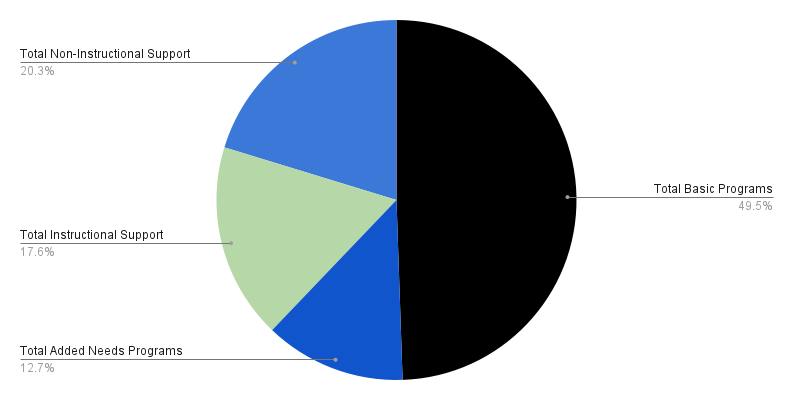
Half of all state districts’ spending is going to General Education. Another 13% goes to Added / Special Needs. This leaves about 38% spent on Support Services. This serves as a high level starting point to compare to individual districts. Let’s also recall that the majority of Michigan’s ~515 school districts are smaller than the GPPSS, which is about the state’s 30th largest district (by enrollment). This has an effect on proportions.
Why does this matter? Because larger districts have some scale advantages. Administration costs, especially general administration, get spread over a larger base for larger districts. On the other hand larger districts have more buildings to support, more bussing needs, etc. which drives higher spending in Operations and Maintenance and Transportation. In short there is nuance in all of these figures.
Now let’s look at the GPPSS’ proportional spending history (except 2023 which is the amended budget). The dashed black line of 100% means that if spending exceeds that line, the district ran a deficit that year.
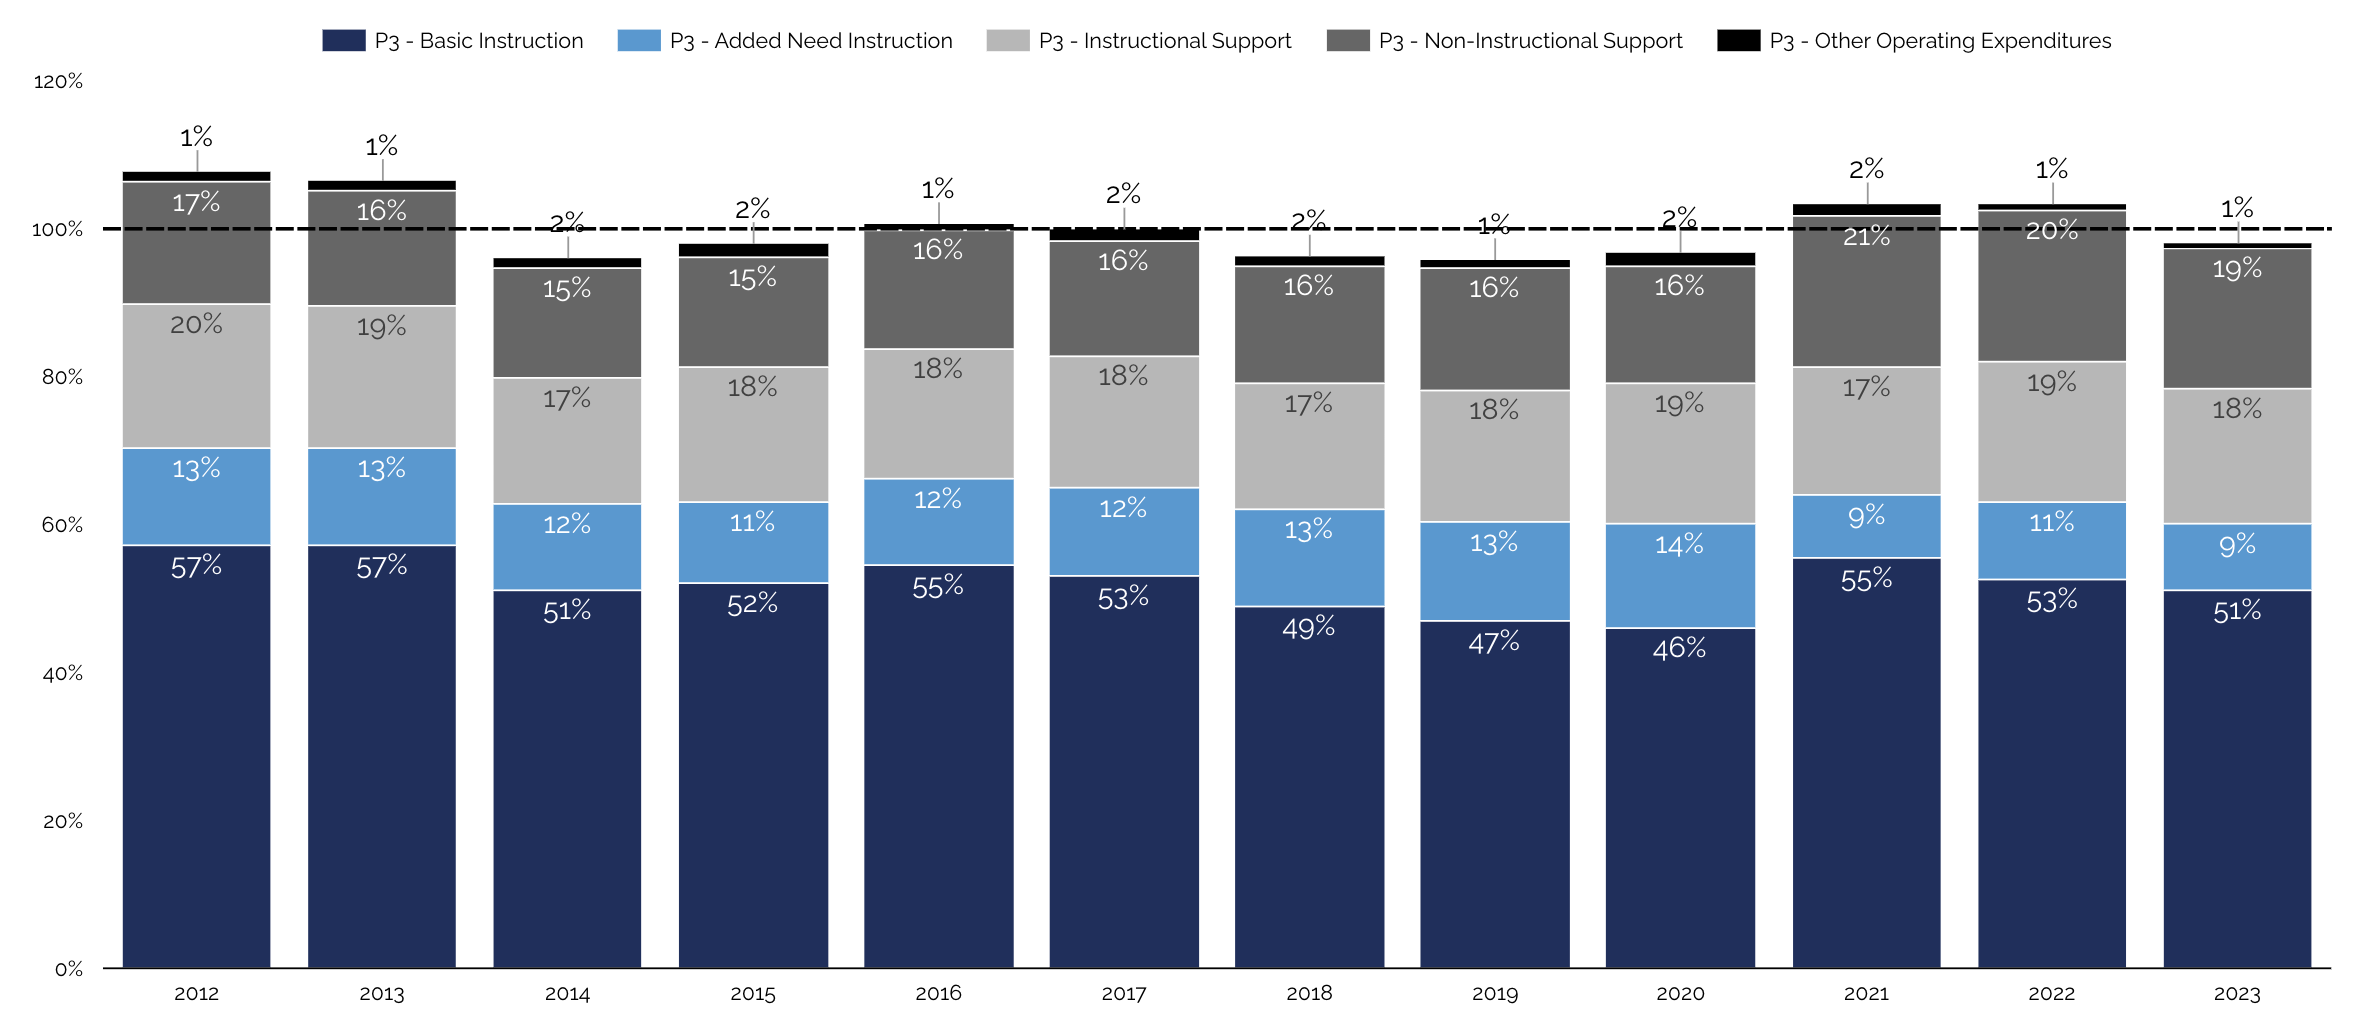
At a high level we can see in the last couple of years the GPPSS’ Instructional spend in total is about 64% of its total revenue. The statewide total is about 62%. Pretty close, right? But just remember as a rule of thumb, every 1% in the GPPSS’ case is $1 million. Also note that starting in 2021 the GPPSS changed some accounting practices which probably account for the change in the Added Needs proportion. Also worth noting, as indicated by the 2023 budget, the district has targeted proportional spend reductions across the board.
Want more nuance? This is probably more on account of the GPPSS anticipating revenue increases a opposed to spending cuts. You now get a sene of some of the complexity at work here.
In general, however, what gets my attention in the GPPSS chart? I’d want to dig into Instruction much more, but Non-Instructional Support (dark gray in above chart) really pops here. Its cost increase was a primary contributor to the deficits in 2021 and 2022 especially.
But we can get even more context by comparing GPPSS to “like districts” and their proportional spend for the 2022 fiscal year.
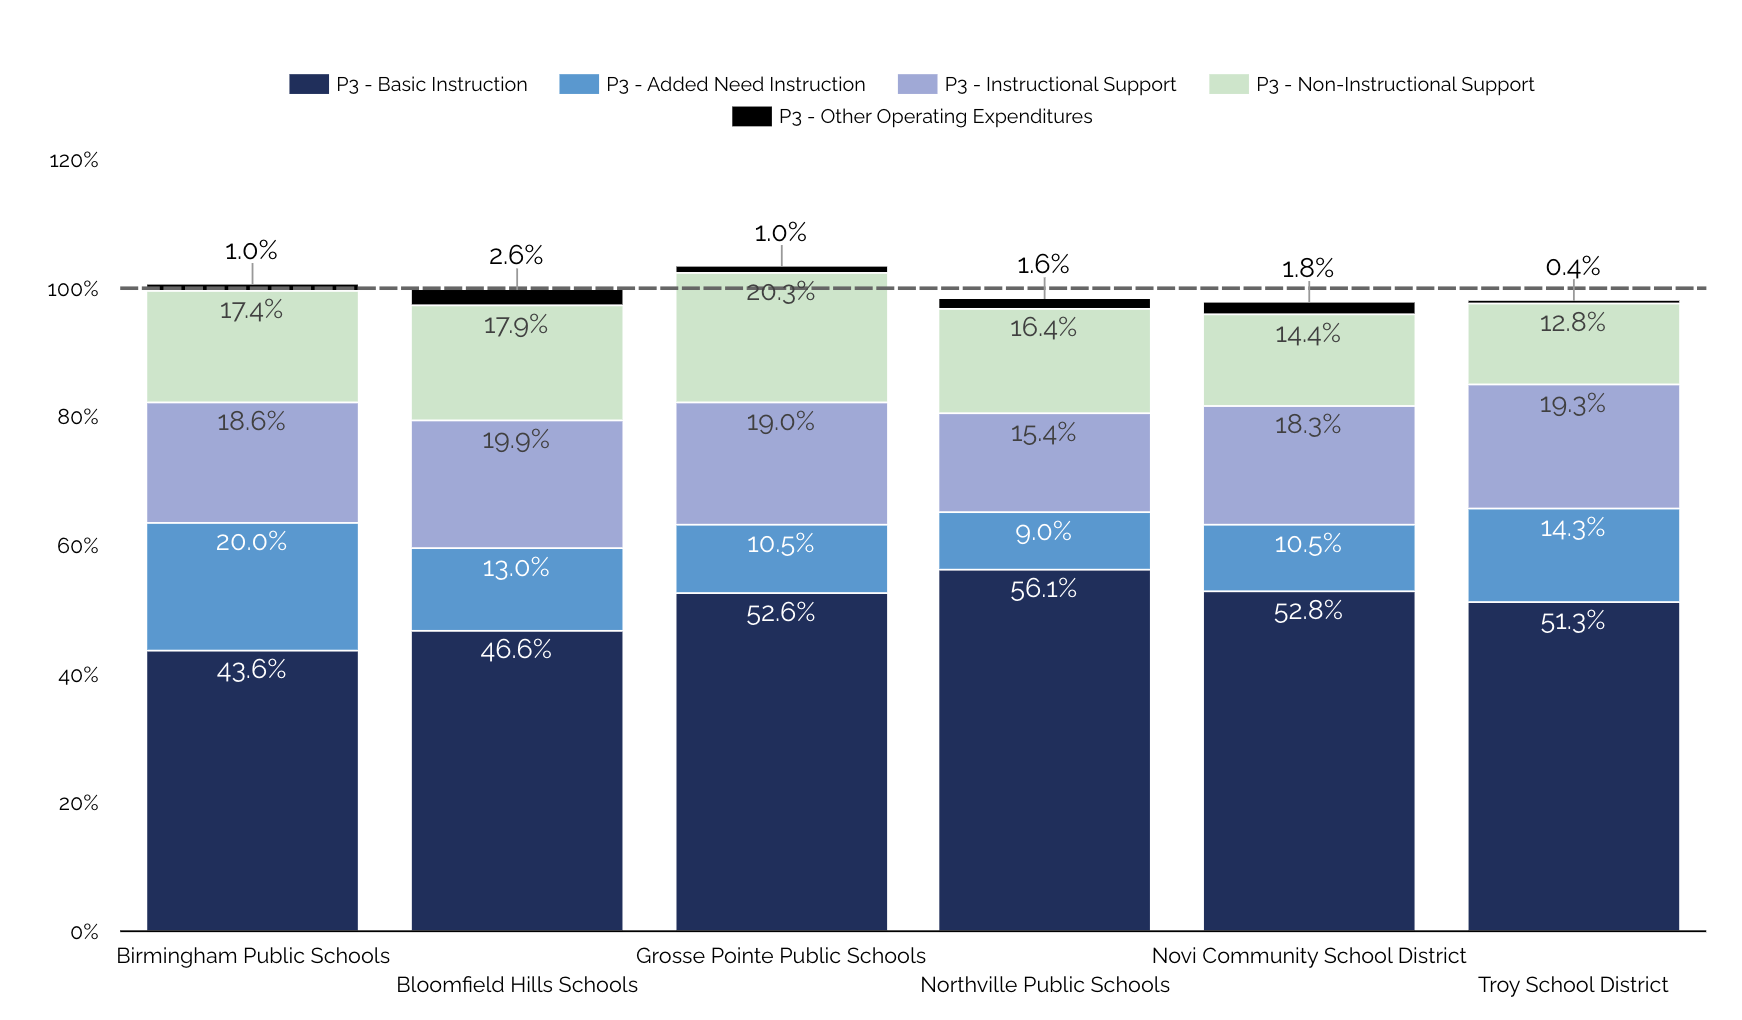
The GPPSS ran a $5.2 million deficit this year and it shows in this chart – especially when triangulated with the historical GPPSS chart further above. Doing so gives us local context and shows where our proportional spend is increasing. And then the peer district chart offers a different comparison. Again Non-Instructional Support costs jump off the page.
We can narrow our scope accordingly. Here is the benchmark view of Non-Instructional Support costs.
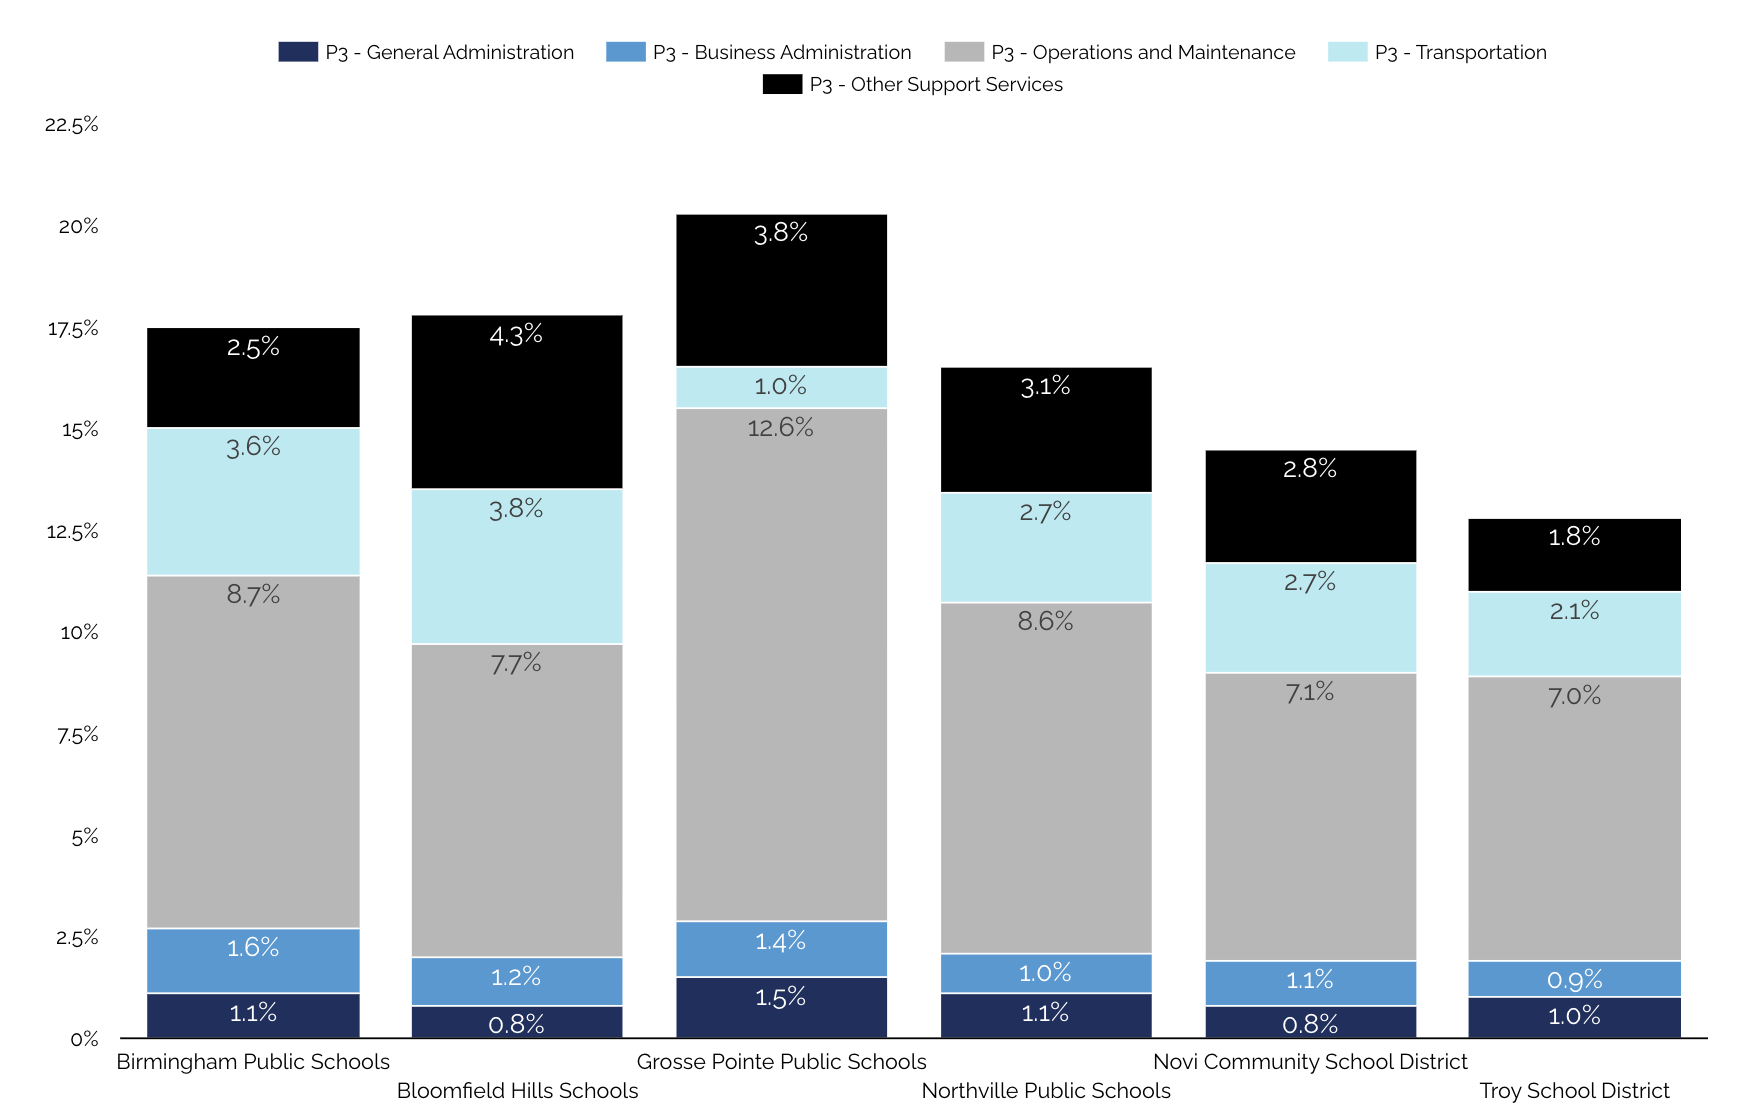
Lots of interesting observations here. You don’t have to be an expert to see that the GPPSS is an outlier in Operations and Maintenance (in a bad way) but we can see also the advantage we have on account of lower transportation costs. That category gave us a $1.5 to $2.0 million advantage over other districts, but that gets the Pac Man treatment from Ops and Maintenance.
{Edit based on feedback: Yes, I know the GPPSS has old buildings. But it’s not as though they have not received significant investment from 20 years of bond and Sinking Fund dollars. It’s also not as though many districts don’t have old buildings as well – including our peers. And upon analysis maybe the conclusion is to not cut this budget, but it would be simply irresponsible to not thoroughly analyze this spend for cost reduction opportunities.}
I could keep going but let’s wrap up for now.
My view of the data supports the theory that the Support Services category (both Instructional and Non-Instructional Support) need scrutiny – especially Non-Instructional Support. Frankly so does Basic Instruction – which stands to reason given the district’s declining enrollment. Recall that declining enrollment will lower the denominator of all these proportional measures (i.e. revenue) which in itself will increase the proportional spend figures across the board.
Frankly all spending categories needs scrutiny given the losses of the last two years, but I hope this explanation sheds some light on why Support Services should get special attention. Aside from it being the spend furthest away from the classroom, the proportional spend trends and compared to other districts points in that same direction.
7 responses to “Let’s Talk About Support Services”
Wow, this was so helpful! Thank you for taking the time to do this. It makes a lot of sense!
I am new to the area. Which of our peer districts still have buildings from the 1920’s?
Someone else answered this above. I do not thing age of buildings is the sole determinant of operating costs after decades and millions of bond and Sinking Fund dollars.
Absolutely the best information I’ve seen! I couldn’t agree more, we cannot continue to operate in the red. Cuts must be made.
Thank you for putting this together; good data points. One thing I want to highlight is that it’s not just that we have old buildings, we have the oldest buildings compared to the peer districts listed here…
– The average age out our buildings is 79 years old.
– Birmingham is next at 65 years
– I didn’t count Bloomfield as I know they have many newer buildings, and it was difficult for me to get the ages of several of their buildings
– Northville is 32 years
– Novi 44 years
– And Troy, with nearly 2x the number of buildings as GPPSS, is 50 years
But it’s not just the averages…The newest school in GPPSS is North in ’68. Every other district has at least one building built form 2000 or later, a difference of 32 years.
GPPSS:
– 3 Buildings from the 20’s
– 2 from the 30s
– 2 from the 40s
– 4 from the 50s
– 1 from the 60s
Birmingham:
– 2 Buildings from the 20’s
– 7 from the 50s
– 3 from the 60s
– 2 from the 90s
– 1 from 2000 or later
Northville:
– 1 from the 50s
– 1 from the 60s
– 2 from 70s
– 1 from the 90s
– 1 from 2000 or later
Novi:
– 1 from the 50s
– 1 from the 60s
– 3 from the 70s
– 1 from the 80s
– 1 from the 90s
– 1 from 2000 or later
Troy:
– 1 from the 20s
– 3 from the 50s
– 3 from the 60s
– 9 from the 70s
– 1 from the 80s
– 1 from the 90s
– 2 from 2000 or later
Thanks for reading. I am not as compelled by the age of buildings argument for why we are millions higher.
The GPPSS has had a large stream of revenue from at least two large bond approvals over the last twenty year PLUS three renewals of Sinking Funds. And on top of that we have recently closed two buildings (I know not entirely closed but much less used.)
Smart districts find a way to invest capital dollars (bond money) in a way to reduce operating costs. GPPSS has not done this.
Thank you! The key is hiring good facilities managers that fix problems with money spent rather than throw money at problems and the problems remain.