
This “Benchmark Project” (intro here) compares financial, demographic, and census data from ten Metro Detroit, upper-middle class suburban cities and school districts: Ann Arbor, Birmingham, Bloomfield, Farmington, Grosse Pointe, Northville, Novi, Plymouth-Canton, and Troy.
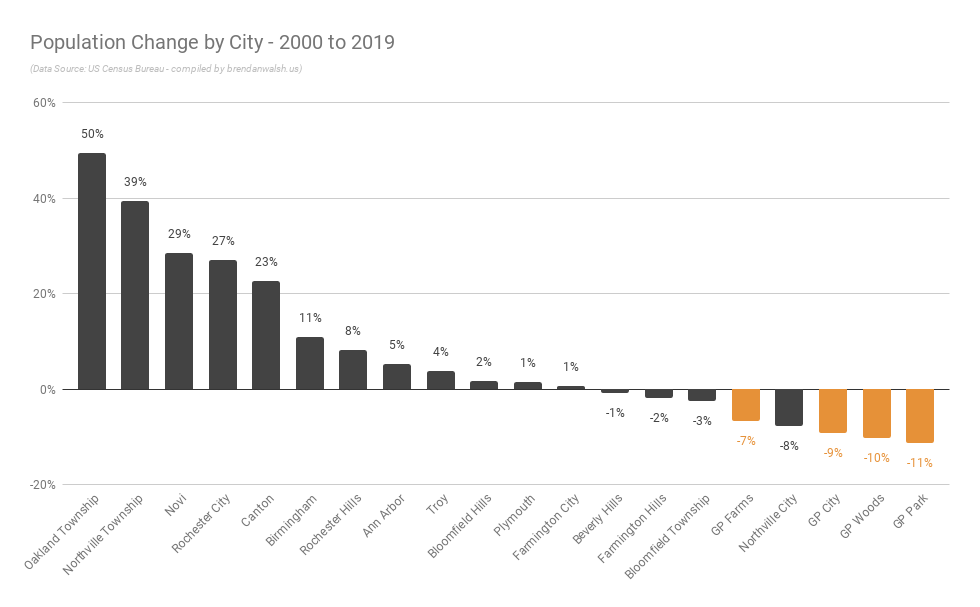
In my post on population trends we saw that over the last twenty years the declining population in Grosse Pointe Farms (-7%), GP City (-9%), G.P. Woods (-10%), and G.P. Park (-11%) is out of step with the other benchmark districts.
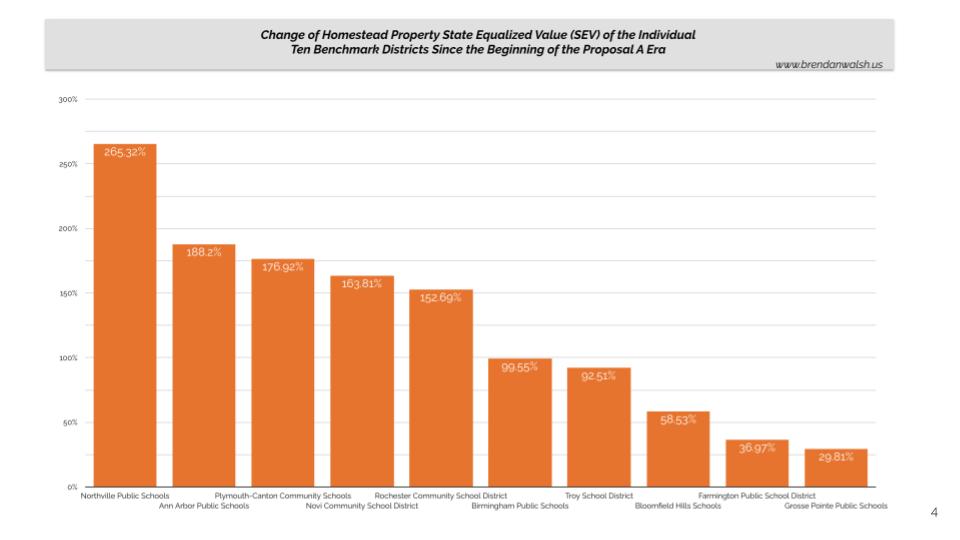
A previous entry about property values and the change in State Equalized Value (SEV) shows that that the GPPSS communities (as with population change) brings up the rear among the benchmark districts.
So that’s two big strikes out of the gate for the G.P.s: contracting population (which means fewer students) and muted home value appreciation (which means taxable values stagnate).
Questions that came to my mind: Could GP home values price us out of growth? And would increases in property values be less pronounced if homes had a higher baseline cost? (Statistically that would make sense.)
We can start by looking at median value of owner-occupied housing units. In the chart below, we see G.P. City, Park, and Farms communities near the middle of the road among the benchmark group.
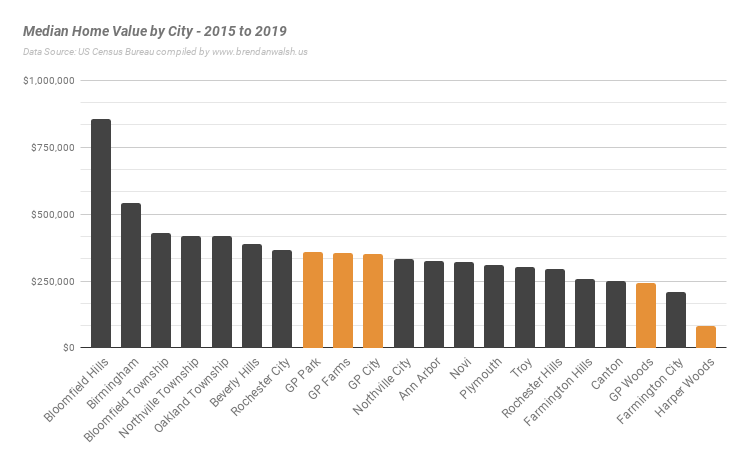
The high-flying outliers (Bloomfield Hills, Birmingham) get your immediate attention, which suggests the Grosse Pointes’ tendency to self-categorize with Bloomfield Hills and Birmingham is problematic. G.P. home values are just not in the same league. We’ll see this again when we look at per-pupil funding. We can also notice Harper Woods in this chart as an outlier on the low end. Finally, we can see that GP Woods has substantially lower median home values compared to their GPPSS neighbors.
So if we’re struggling to understand why the G.P. communities’ populations are shrinking while others grow, the median home value does not seem to be the problem. If anything, this data shows us that again, with some exceptions on the edges of the bell curve, the benchmark communities we have selected represent the G.P.s’ metro-Detroit suburban competition.
On the other data point, it is possible that the G.P. communities’ relatively weak SEV appreciation could partially be attributed to a higher baseline from the start, but even that is hard to defend when we consider both Birmingham and Bloomfield’s SEV growth has far outpaced the GPPSS. (See the second chart above.)
The emerging theory for me is that we definitely have some core deficiency that is hampering the G.P. communities’ population and economic growth. We’re out of step with our peers and an objective read of the data would lead most to conclude that the GPPSS communities have a problem that needs to be identified. I don’t say that knowing what the problem is, but as the saying goes, the first step to solving a problem is admitting you have one.
In an ensuing post we’ll look at tax rates as another possible differentiator.