The City of Grosse Pointe Woods millage increase proposal raises some serious questions and provides a good opportunity to perform the kind of thoughtful analysis such a decision demands.
One thing is certain. Any analysis limited to the change in the millage rate alone is incomplete. Taxes are the product of a millage rate applied against a property’s Taxable Value (TV). For a better understanding of Taxable Value this Citizens Research Council report will come in handy.
This trinity of rates, taxable value, and their product – taxes themselves – generates a slew of philosophical questions. But before starting with them, let’s review these three key metrics for all five Grosse Pointe communities.
Using this source, the Michigan Department of Treasury’s “Ad Valorem Property Tax Levy Report,” we can establish a 14 year view of each community’s aggregate taxable value. I’ve had to scrounge for reliable millage rate data, but have general found it on each of the city’s web sites, links therein, and in their audit reports. By applying tax rates against taxable value we can calculate tax receipts.
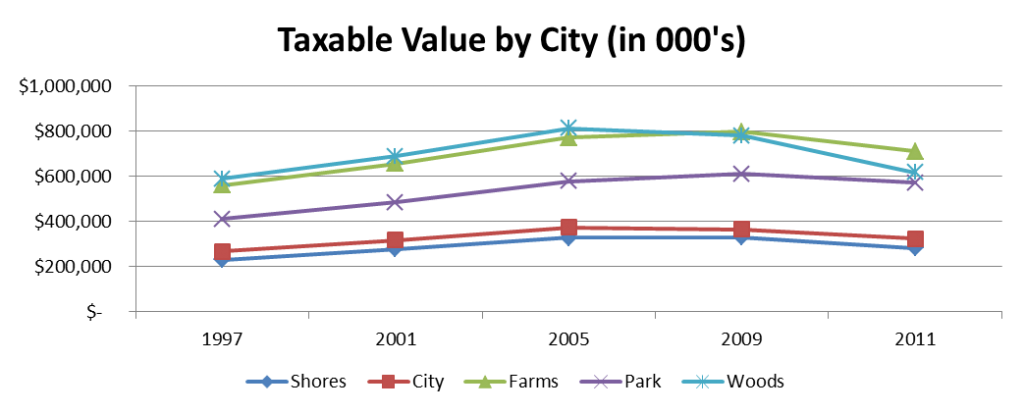
Here’s a view of the aggregate taxable value of all five Grosse Pointe communities from 1997 to 2011.
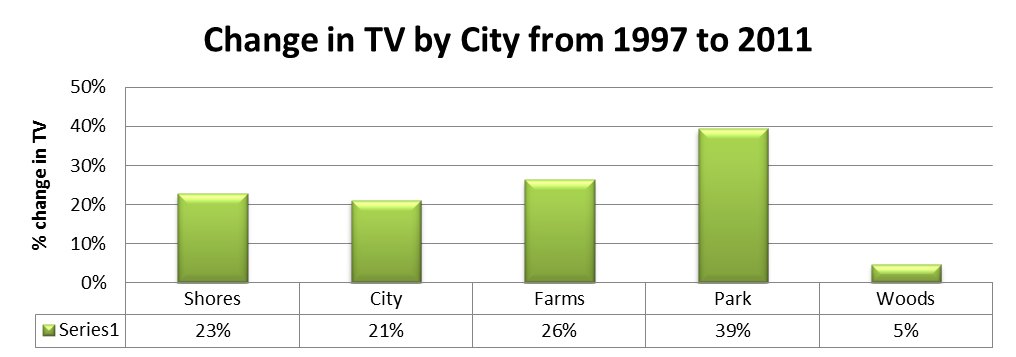
We can learn a decent amount from this view, but we need to go much deeper. For example, just because the Shores has the lowest taxable value does not mean it’s the least wealthy. We’ll see later that it is quite the opposite. Obviously population matters. So let’s break the data down further. Let’s look at the percentage change in each city’s aggregate taxable value from 1997 to 2011 to see comparatively how TV appreciated in each city over 14 years.
This is one of those “good news/bad news” charts. We like property values to appreciate mainly because it indicates a return on investment. (Remember when we used to think of our homes as an investment?) So as TV increased, if the millage rate were to remain flat or increase, taxes paid would also increase.
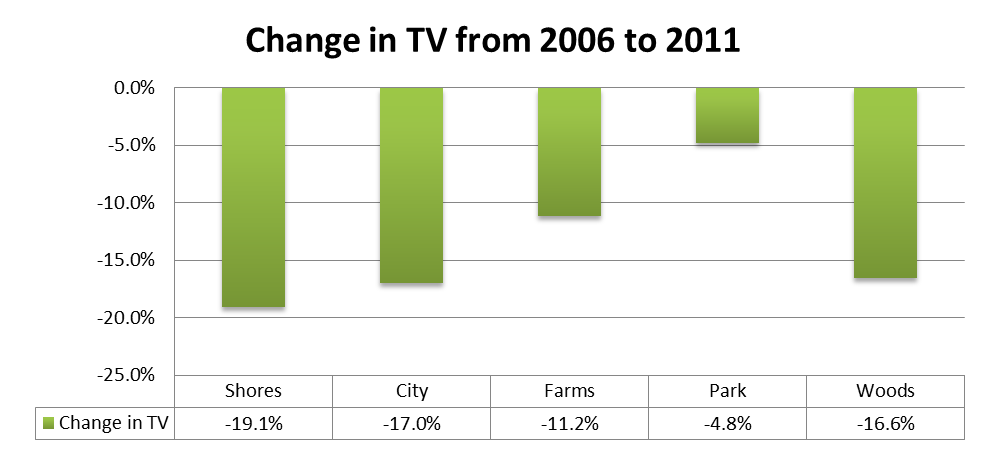
For a more purely “bad news chart” let’s look at the change in Taxable Value from just 2006 to 2011.
Among the five Pointes, the Park is the biggest winner from 1997 and on and also the city whose taxable value depreciated at the lowest rate from 2006. We’ll see shortly how all five Pointes responded to this TV reduction by raising millage rates.
To get a different view, we can cut the data on a per capita basis. Let’s cross reference each city’s taxable value with its population. Here’s a view from the year’s 2000 and 2010 using respective census data:
|
Year 2000 |
Year 2010 |
Percentage Change |
||||
|
Population |
TV per Capita |
Population |
TV per Capita |
Population |
TV per Capita |
|
| Shores | 2,823 |
$98,694 |
3,008 |
$94,480 |
6.6% |
-4.3% |
| City | 5,670 |
$55,917 |
5,421 |
$59,664 |
-4.4% |
6.7% |
| Farms | 9,764 |
$67,152 |
9,479 |
$74,906 |
-2.9% |
11.5% |
| Park | 12,443 |
$39,002 |
11,555 |
$49,578 |
-7.1% |
27.1% |
| Woods | 17,080 |
$40,306 |
16,135 |
$38,250 |
-5.5% |
-5.1% |
The population story here is generally pretty bad, with all but the Shores losing population at multiples above Michigan’s nation leading population loss. (Michigan’s population decreased 1% from 2000 to 2010, the only state in the country to experience population loss.) From a big picture perspective, population loss in the Grosse Pointes clearly has to be a concern.
The taxable value per capita is a particularly bad story for the Shores and Woods, but for different reasons.The Shores drop was driven more by their rise in population, yet their taxable value increased by 23%. The Woods experienced a 5.5% drop in population and had weaker taxable value appreciation.
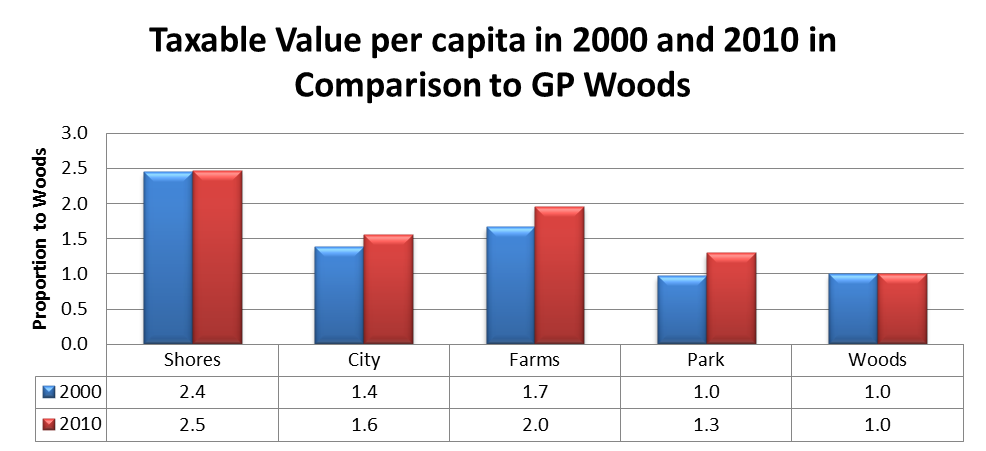
Here’s how all the Pointes’ TV per capita compare in relation to Grosse Pointe Woods by using it as the denominator against each of the other’s TV per capita. (Notice the Woods measure is 1 in both years):
In the year 2000 the Woods and the Park had roughly equal measures of wealth, if we accept taxable value per capita as a reliable measure, both of which lagged the other three. They still do, but by the year 2010 the Park opened a 30% gap over the Woods and the other three cities increased their gap over the Woods as well.
The implication is significant. If all the Pointes want consistency among them in terms of staffing ratios (think police per citizen), employee compensation, and quality of service then it only stands to reason that millage rates will be proportionally varied. Those with higher TV per capita should be able to have lower rates and those with lower TV per capita wuld need higher millage rates.
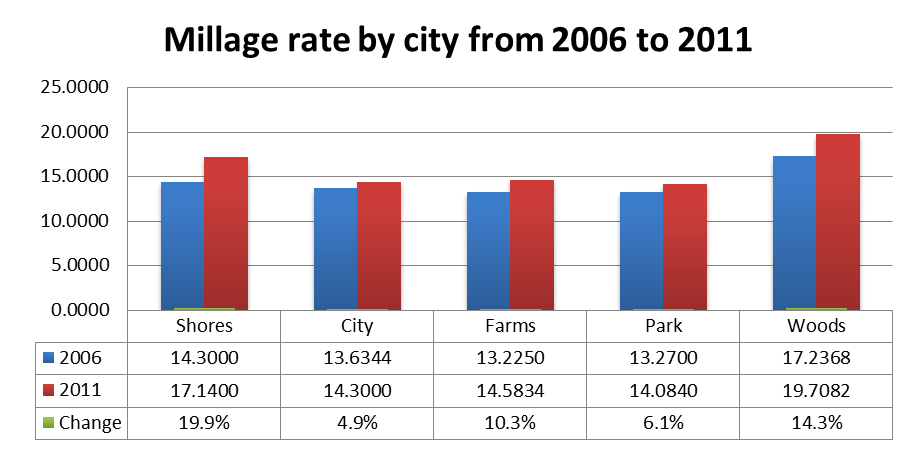
As we now look at the millage rates for each, we see this prediction holds true for the Woods, but the Shores is more of an anomaly.
The Woods has consistently had a higher millage rate than the other Pointes and the percentage increase of the Woods rate increased over this time at a rate surpassed only by the Shores. Given the Woods relative lower TV per capita, that would make sense IF they staff and compensate at levels equal to the others.
Oddly the Shores, which has a TV per capita 2.5 times greater than the Woods and higher than all the other Pointes has a relatively high millage rate. To make sense of this, we’d need to benchmark services, ratios, compensation rates and non-millage fee structures. I would caution against drawing conclusions solely on this basis, but it sure merits more analysis.
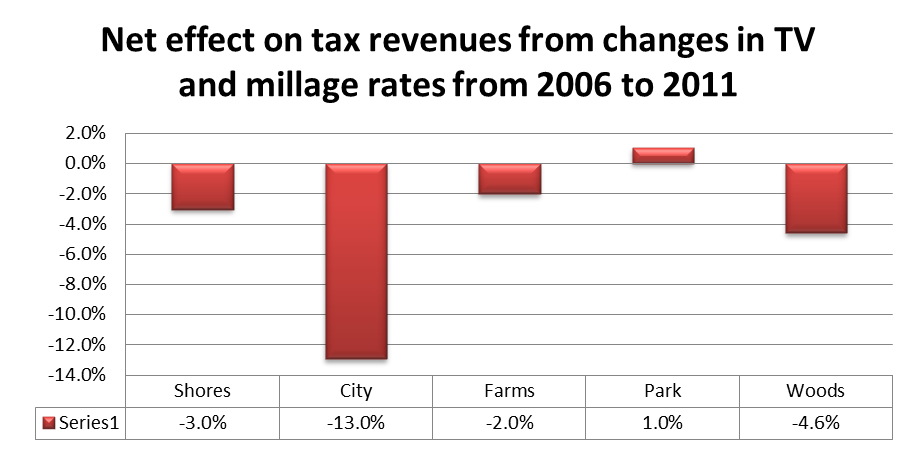
Here’s a view of the compound effect of higher millage rates and lower taxable value from 2006 to 2011. This is derived by applying city millage rates against aggregate taxable value and calculating the tax receipts from 2006 to 2011.
Here we see that all cities except the Park experienced decreased city millage based tax revenue. (Again, cities do have other revenue streams.) The Park’s stronger taxable value has been their salvation. The City has been hardest hit, mainly because they increased their millage rate the least.
And now we get to the tax philosophy questions: Did Park residents experience an increase in their taxes based on this data? Did all the others enjoy a tax cut? What constitutes a tax increase or reduction, a rise/fall in the rate or in what is paid?
This has been the crux of the Woods millage supporters argument. They argue the more recent drop in TV has resulted in reduced tax receipts, thus justifying a millage rate increase.
These metrics don’t induce warm and fuzzy feelings for the Woods:
- They have the highest millage rate among the Pointes and are looking to increase it.
- Their taxable value per capita decreased, and was the least favorable of all the Pointe’s from 1997 to 2011.
- They experienced the lowest rate of taxable value increase of all the Pointes since 1997, less than 1/8th the rate of the Park.
There are no irrefutable answers in politics or even in tax policy for that matter, but there can be agreement on the right questions to ask. In these matters, I would pose the following:
- What constitutes a tax increase or tax cut, a rise or fall in rate or in taxes paid?
- Should all the Grosse Pointes expect equal services and to have equivalent employee compensation structures when there is such a variance in revenues based on taxable value per capita?
- Can the Woods continue to increase millage rates as a means to offset lower rates of growth in taxable value?
- What are the implications for employee compensation and city services if certain cities among the Pointe’s increase or enhance theirs due to faster rising taxable value and higher millage rates?
Looking at the bigger picture for all the Grosse Pointes, a few things need to happen. Each of the Pointes must benchmark their services and structural costs with one another and other similar communities to find best practices. I’d want to know:
- what has the Park has done to stabilize taxable value?
- how do compensation models differ given the the 2.5x variance in TV per capita across the five Pointes?
- how has the City maintained services without increasing rates and experiencing such a drop in TV?
- what have each of the cities done to affect non-millage based revenue streams?
As for the citizens of Grosse Pointe Woods, whether they each ask themselves these questions on Tuesday, we’ll never know, but the Woods voters have a lot to consider and should do so armed with the facts. The point here is to provide what I think is an unbiased presentation of data because, frankly, I’ve seen such skewed or incomplete data in the public debate on this matter.
Post Script from original publishing of this article:
Given the many other variables to consider outside of millage rates and taxable value, I harvested the Munetrix data source to capture some pertinent financial data for each of the Grosse Pointes for 2006 and 2011. This allows us to calculate the change in these metrics over this five year span as taxable value declined.
|
Change from 2006 to 2011 |
|||||
|
GF Expenditures |
GF Revenues |
GF Balance |
Long Term Debt |
Long Term Debt as % of Revenue |
|
| Shores |
-2% |
9% |
2% |
-17% |
-23% |
| City |
-20% |
-21% |
-43% |
-29% |
-11% |
| Farms |
10% |
-2% |
14% |
-6% |
-4% |
| Park |
1% |
3% |
38% |
77% |
72% |
| Woods |
17% |
-5% |
4% |
-69% |
-67% |
| Data Source: http://munetrix.com/Michigan/Municipalities/01-SEMCOG/Wayne-County/Cities | |||||
Each city’s line tells its own unique story and highlights strengths and weaknesses in each:
- Shores: Despite a 19% decrease in taxable value over this time, their revenue actually increased by 9%. They’ve maintained and even strengthened their fund balance and have reduced long term debt – not a great surprise given their increase in revenue.
- City: They’ve achieved a nice balance by reducing expenditures in proportion to their massive revenue reduction while also improving their debt position. But their fund balance has suffered as a result. This could prove to be a good strategy and very favorable to taxpayers if, over the next few years, taxable value can improve.
- Farms: They’ve had the second largest increase in expenditures against moderate revenue loss, but they’ve also increased their fund balance and reduced long term debt. This is a fairly stable picture, but rising expense structure is a threat.
- Park: All in all a stable picture, but the massive increase in long term debt has to be a concern. I expect the picture is skewed due to a bond issue within this five year window.
- Woods: The imbalance between their significant increase in expenditures against declining revenue is a concern, but they’ve made great strides to reduce long term debt. Perhaps there’s a correlation between expenditures and paying down debt, but I don’t have enough data to make that determination.
