Yes, I did a similar analysis last June. If the horse were truly dead, I’d stop beating it. But the risks run by the Grosse Pointe Public School System remain great and this particular view of the data helps substantiate those risks.
The 2015 data, like last June’s 2014 data, shows five Michigan school districts with similar profiles as it relates to average teacher salary and ratio of pupils to teachers. This is an important cross reference because exceeding the average in one makes it particularly hard to exceed (or best) the other. This assumes a lower ratio is preferred and there are good reasons to believe this to be true. The higher that ratio the more likely class sizes are higher or course offerings – and now even school building viability – are reduced. Parents of students generally dislike those things.
With flat or falling revenues, particularly due to declining enrollment, increasing average teacher salaries is commonly followed by teacher staff reductions. This increases the ratio of pupils to teachers.
My refreshed analysis again focuses on the 212 Michigan school districts with enrollment above 2,000 students that cumulatively account for 1.1 million (or 71%) of all Michigan K-12 students. Here’s how they graph out on average teacher salary and ratio of pupils to teachers.
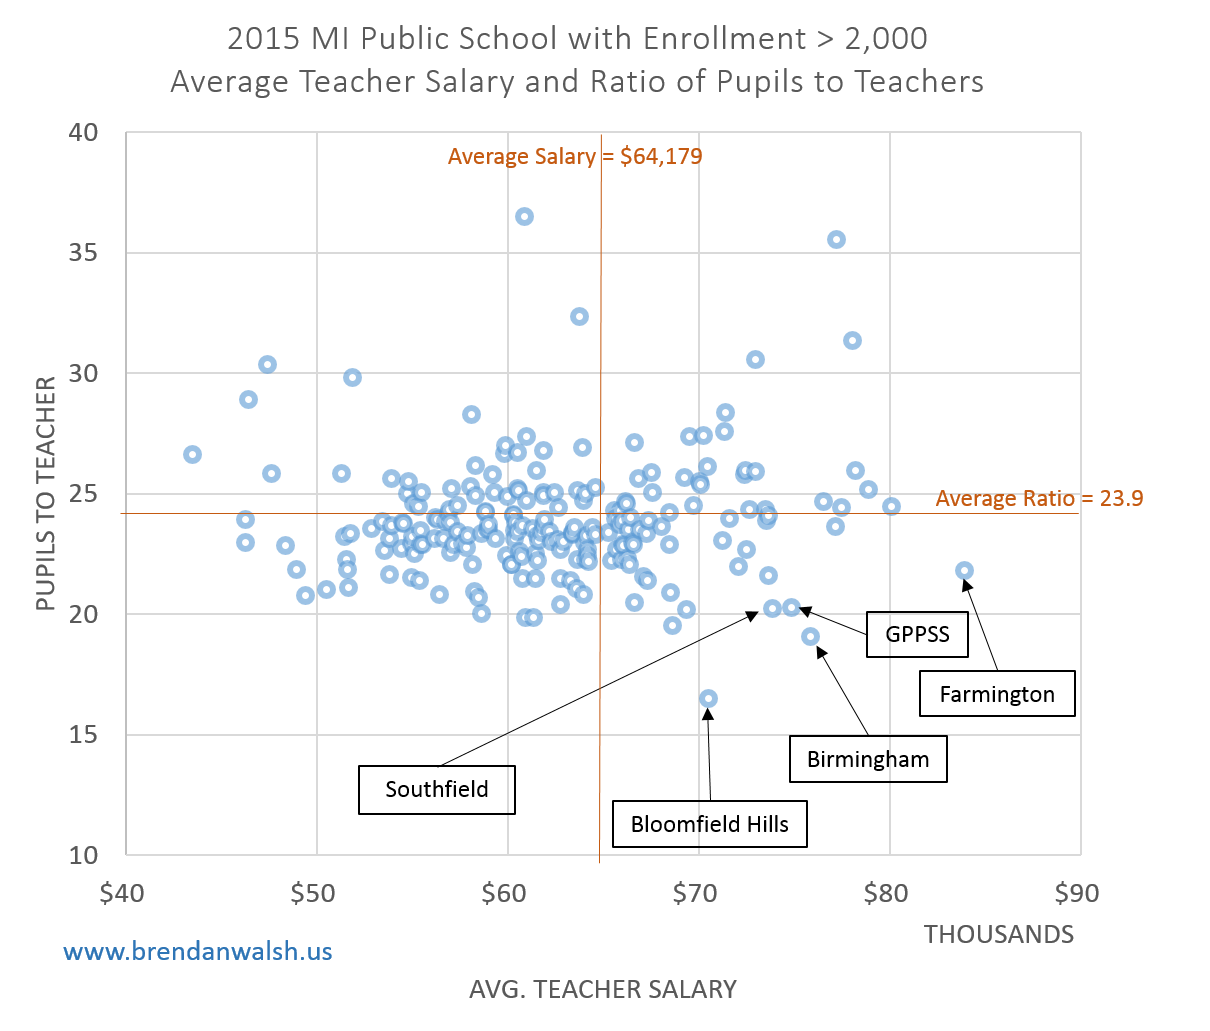
Dots right of the center vertical (orange) line represent districts that pay their teachers on average more than the group average of $64,179. Dots below the horizontal (orange) line have pupil to teacher ratios below the group’s average of 23.9. The bottom right quadrant districts therefore have both higher than average salaries and lower than average ratios of pupils to teachers. Just 38 districts (or 17%) are in this quadrant.
The districts I have labeled represent the outermost edge of this quadrant and their stories illustrate how difficult life on this edge is. Let’s see how their financials react (or support) their edge position.
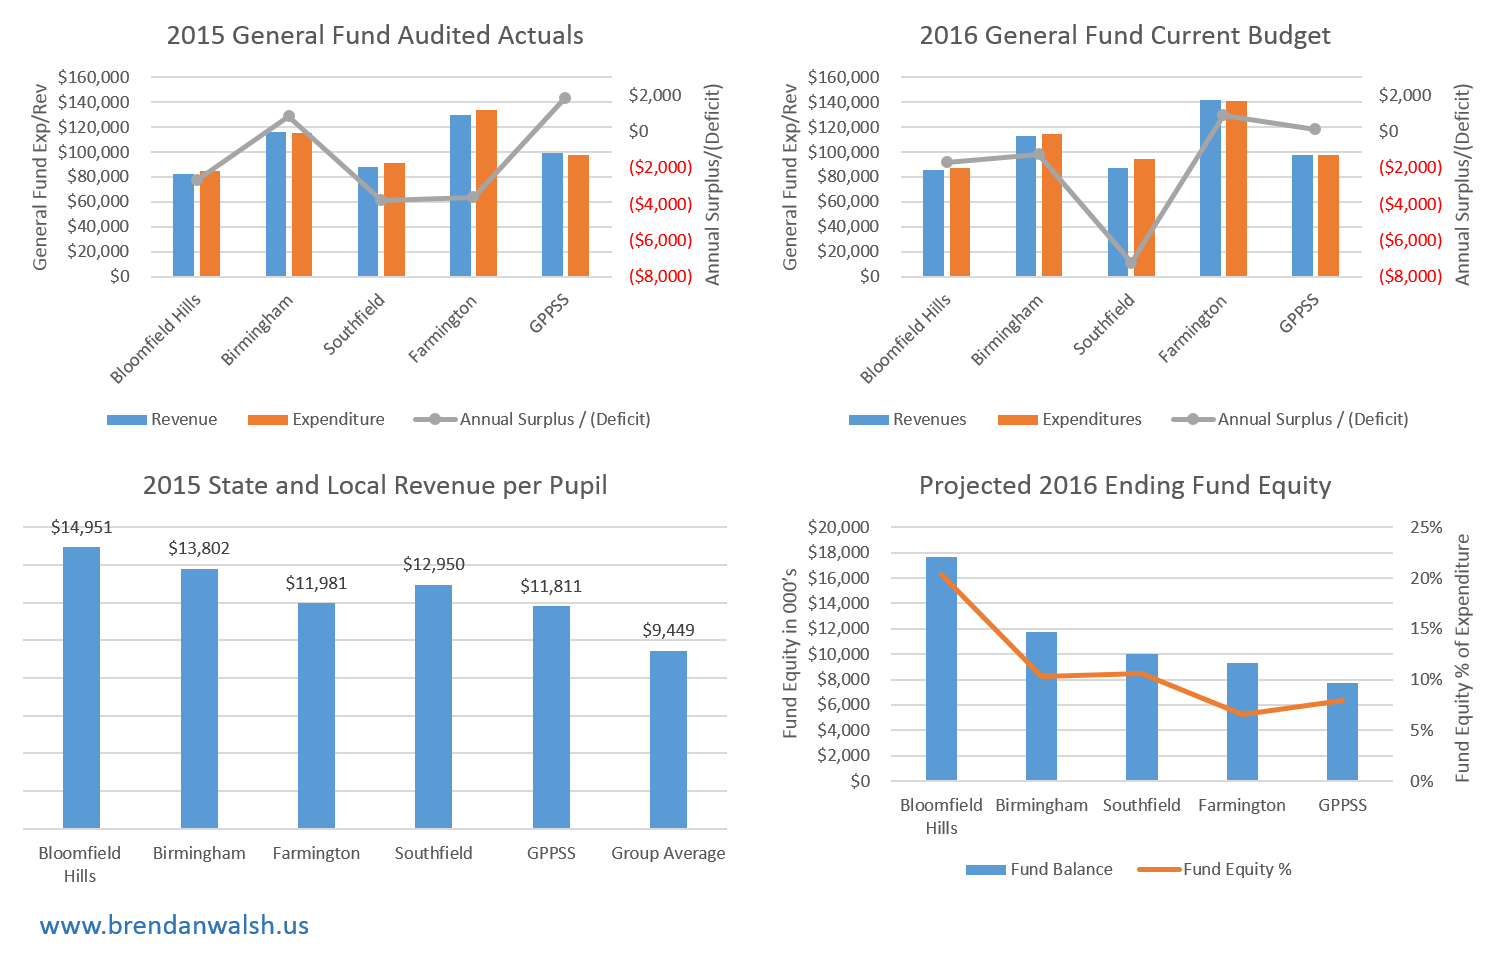
Starting at the top left graph, three of the five districts we examine ran substantial deficits in 2015. Bloomfield’s annual deficit was $2.7 million. Southfield’s and Farmington’s annual deficits both approached $4 million. Birmingham ran a moderate surplus and the GPPSS ran a nearly $2 million surplus.
In 2016 (the districts’ current budget) Southfield’s situation has gotten worse as they project to run a $7.2 million deficit. Bloomfield again projects a deficit and is joined now by Birmingham. GPPSS and Farmington run break even budgets, but as we know from Farmington’s situation, this doesn’t mean much..
On the bottom left graph we see why these five districts can even afford to be on the edge in the first place. Each has per pupil revenue well above the 212 district average of $9,449. But even among these five, there are have’s and have not’s. Bloomfield and Birmingham are in a different revenue league than every other district in the state. Bloomfield leverages that position to have – by far – the lowest pupil to teacher ratio in the state. Birmingham has been more balanced, but has the second lowest pupil to teacher ratio in the state and tenth highest salary (one slot ahead of the GPPSS).
Southfield’s and Farmington’s recent school closing actions proved that they are playing a game they cannot afford. Both have announced complete district reconfiguration plans that involve several school building closings and undoubtedly heavy staff reductions. (Southfield plans are here and Farmington’s here.) Also recall that Bloomfield closed a high school a few years ago and Birmingham took nearly every budget enhancing option the GPPSS rejected: outsourced custodians, adopted trimester schedules in high schools, approved limited schools of choice, and allowed non-resident staff to enroll their children.
To complete the circle, we see again in the bottom right graph the fund equity cushion Bloomfield has ($18 million or about 20% of total expenditures). Birmingham and GPPSS are holding steady in the 8% to 10% range while Southfield and Farmington are almost certain to see more losses before they stabilize.
That would leave the GPPSS in the company of just two districts who happen to have revenue per pupil that averages $2,500 more than the GPPSS’. $2,500 more per pupil in the GPPSS would yield about $20,000,000 more revenue annually than our current levels. In short, the budget planning would be a breeze.
But of course that’s not the case and this means we are keeping company with much wealthier districts. We see what happened to Southfield and Farmington when they tried to do this. These are not exactly Kalkaska type districts. They have revenue per pupil well above the state average, as does the GPPSS. But they both have declining enrollment, which is a problem for the GPPSS as well.
Bloomfield can muscle through this challenge because of their extraordinary revenue per pupil and the very difficult school closing decisions they made. Birmingham also has extremely favorable revenue per pupil, their enrollment is increasing, and they made a variety of very difficult budget choices (listed above).
The GPPSS has not closed any schools and there’s been no talk of it. We executed none of the tough budget decisions Birmingham and so many other districts have. The GPPSS did one thing: the 2010 contract and what became known as the Grosse Pointe Formula.
As we near the final year of the employee contracts that essentially froze the Grosse Pointe Formula until August 2017, the current Board and administration would do well to recognize what enabled the GPPSS’ existence on this edge and how we got there. If they want to change course, they had better look to the right and left and see what our lower right quadrant neighbors have done and ask if they are ready to do the same.
3 responses to “Living on the edge”
Thanks Brendan. The above information is very helpful even for board members like me who don’t reside in SE Michigan.
Can you tell me what dot is Huron Valley School District
Hi Bob,
Huron Valley Schools are in the upper left hand quadrant, but just barely. They are very near the lower left hand quadrant.
HVS has a pupil to teacher ratio of 24.18 and an average teacher salary of $56,857. So it is just above average in ratio and 11% below the teacher salary average. It is well on the left hand side of the graph.
It’s a big district, 21st largest in the state and their revenue per pupil is in the middle of this pack of 212 districts. They get $9,585 per pupil, which ranks them at about 100 on this list and 6% below the average revenue per pupil of the group. So you’d expect they’d pay their teachers, on average, less than that average.
Hope this helps and let me know if you have other questions. Thanks for reading.
Brendan