These charts will help readers understand the relationship between how much the Grosse Pointe Public School System spends per pupil – and where that money goes – and the ultimate effect on fund balance (or fund equity).
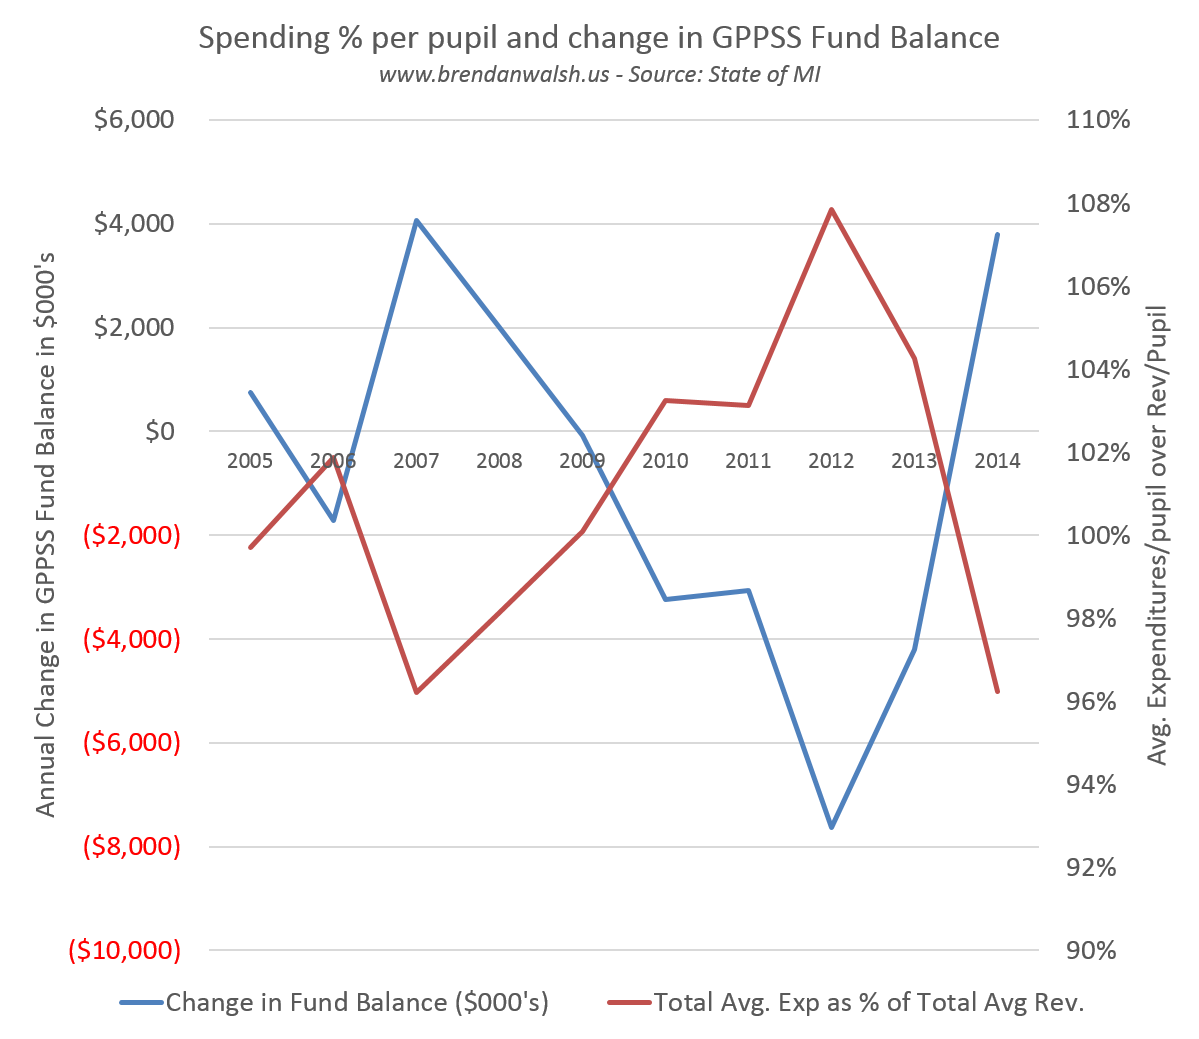
This first chart shows the basics. If we spend above 100% of what we receive in revenue per pupil, the district will run an annual deficit. No shocker there, but sometimes we lose sight of this basic truth.
I highlight three examples in the chart below:
- In 2007, the district spent about 96% of its revenue and ran a $4 million surplus.
- In 2009, the district spent 100% of its revenue per pupil and had no change in fund balance.
- In 2012, the district spent 108% of its revenue per pupil and ran a $7.6 million deficit.
So now let’s look at a couple charts that show where that spending per pupil is going. Here’s a simple view showing percentage spend by instructional (general education and special needs education) and non-instructional (administration, business services, instructional support and transportation).

In 2009, the total instructional and non-instructional spend was about 95% of the total spend. In 2012 that number grew to 106%. A balanced budget of 2009 grew into a $7.6 million deficit as the proportional spend on instruction increased from 63% to 70% of revenue and non-instructional spend increased from 32% to 36%.
So what constitute instructional and non-instructional expenses? As the chart below shows, it’s mostly salary and benefit costs.
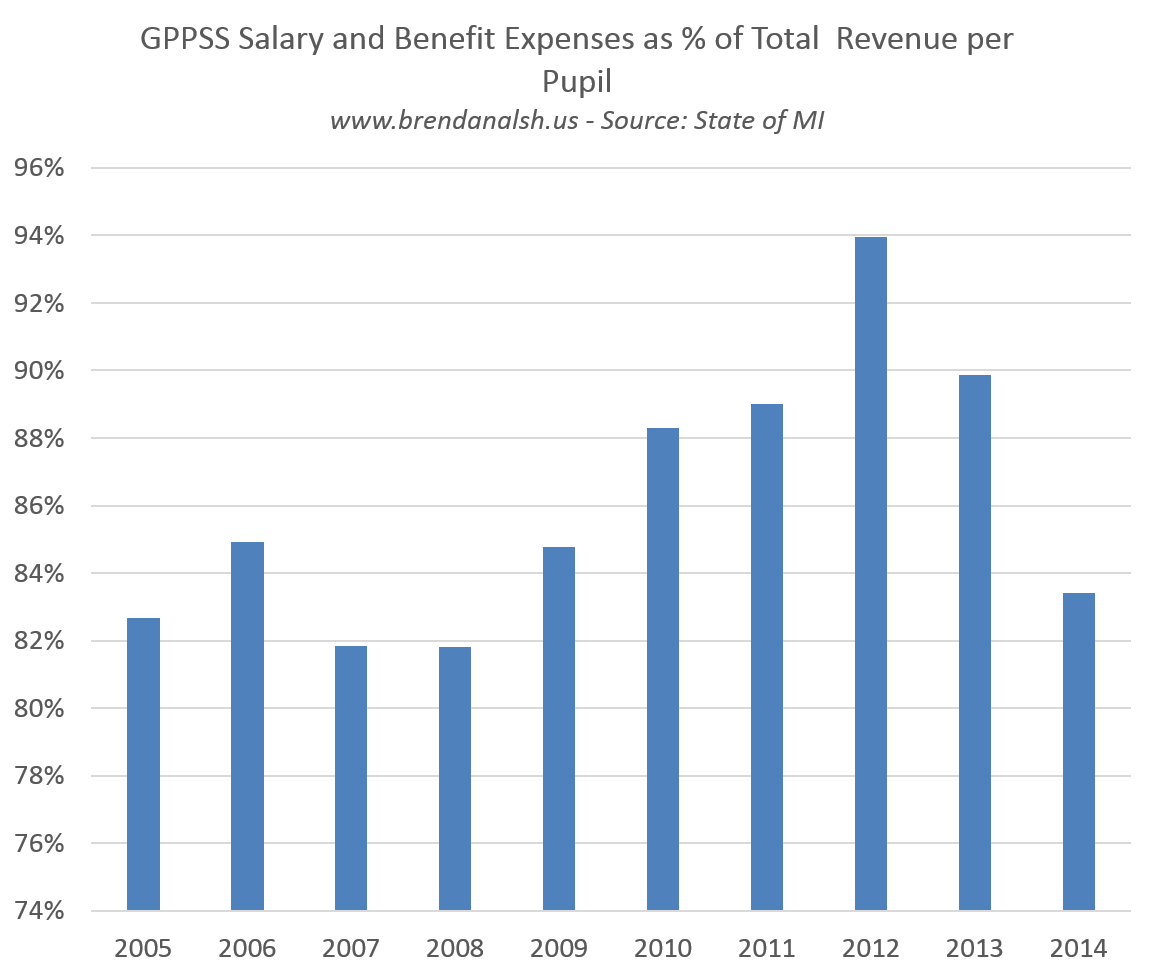 What this tells us in that in years that the GPPSS ran balanced budgets or even moderate annual surpluses, the percentage of spend that was allocated to salaries and benefits ranged from about 82% to 85%. The years where the district spent more than 85% on salary and benefits (2010, 2011, 2012 and 2013) it ran an aggregate deficit of $18 million – a four year span that saw fund equity drop from $20 million to $2 million.
We see now that last year, where salary and benefit costs accounted for 83% of total revenue per pupil, the district ran a $3.7 million surplus. As a result, fund equity will gradually return to 10% within the next couple of years.
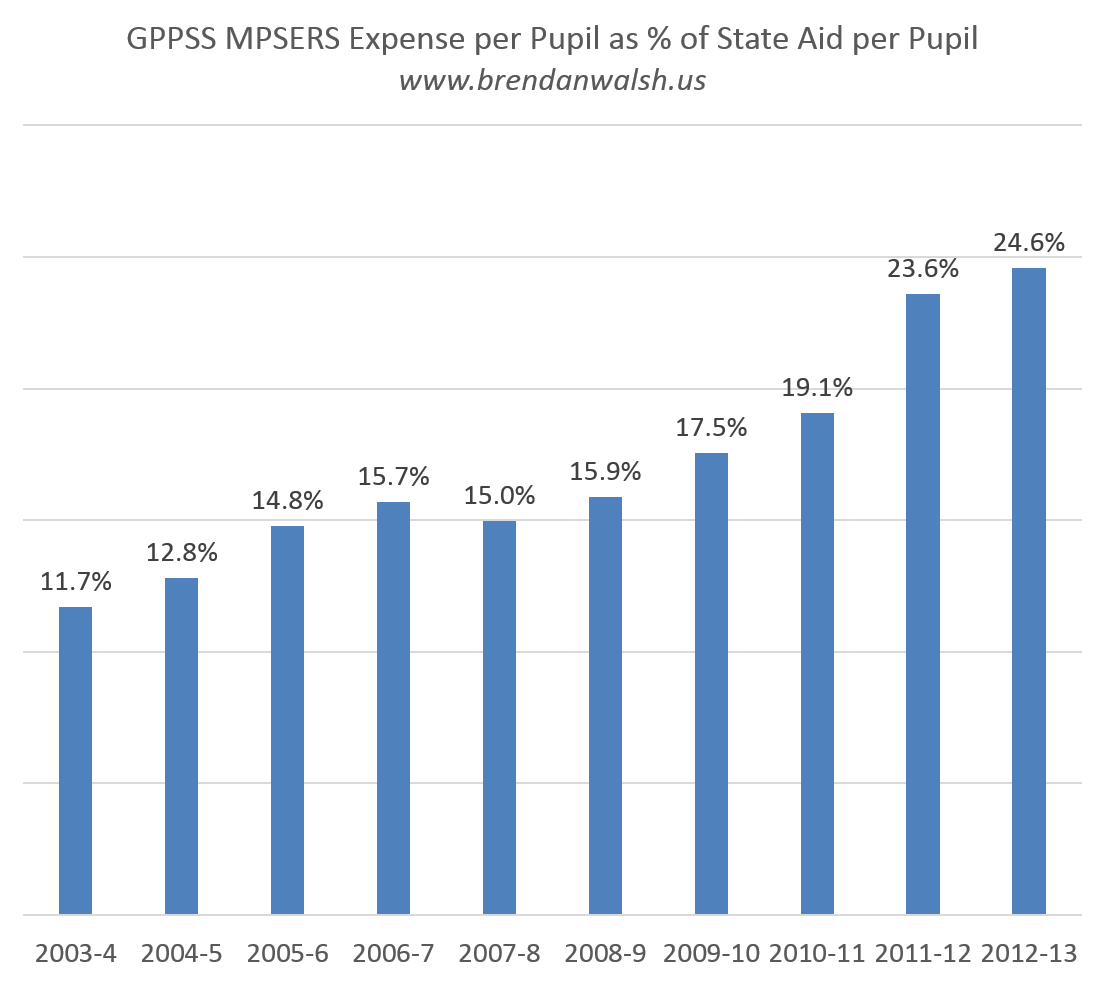
To go a layer deeper, the benefit that caused the greatest problem has been state mandated retirement costs. This chart shows its rising consumption of our state aide per pupil:
In the end, the simple math is that districts like the GPPSS get only so much revenue per pupil. Expenses of all types must be managed to stay within that envelope – and the largest expense will always be salary and benefit costs.
When that simple math is ignored, the district runs a deficit and all kind of bad things ensue.
The good news now is that equilibrium has been re-established and the district has maintained very competitive compensation with favorable class size and student offerings.
4 responses to “The simple math of GPPSS budgets”
Benefit costs will continue to grow as percentage of total comp costs.
Brandon, is GPPSS on a defined contribution plan, yet? Otherwise, when the enrollment drop hits, we’ll be a tight situation. Pension costs will continue grow as our revenue falls.
GP4L,
The state manages the retiree health and pension plan for all Michigan Public School Employees (aka MPSERS). It has historically been a DB plan, but reform early in Gov. Snyder’s term is gradually converting it to a DC plan.
The reform sort of froze pension costs for districts and the state carries that burden. As a result, the local districts tend to get lower increases in funding as the state uses the School Aid Fund to pay down the unfunded liability. It is a painful, but necessary step.
Elsewhere on this blog I have written extensively on the impact MPSERS has had on the GPPSS, and all local school district budgets.
Thanks for reading and commenting.
Brendan
[…] 2007 and 2010. The operating budget funded these areas for years, even before the Sinking Fund, but increases in employee compensation eroded them. This was a key driver in the May 2010 GPEA/GPPSS agreement. This district budget […]
[…] If you get your contracts wrong, almost nothing can be done to make substantive financial change. I treated this topic in depth in this entry from April 2015, The Simple Math of GPPSS Budgets. […]