Standardized test performance is central to almost anything discussed today in education. Governors across the country, including Michigan’s Rick Snyder, quote standardized test results chapter and verse when rationalizing aggressive education reform agendas that place greater emphasis on these results.
As I’ve written before, escalating reliance on standardized tests should be viewed with great caution. Unintended consequences are not limited to decisions in schools that otherwise have high parent satisfaction ratings (see this post for an example), but also lull others into a false sense of satisfaction.
In other words, one should not conclude that low scores on standardized tests are a sign of a bad school any more than concluding high scores mean a school is ideal.
The most troubling aspect of standardized test scores for me remains the correlation between socioeconomic status and test results. I’ve written about this a couple times in the past – (“Reframing the Achievement Gap,” “Which came first, bad schools or poverty,” and here, and here.
The state just released the most recent version of the “Top to Bottom Rankings” (lots of source detail here) that rely heavily on standardized test performance, graduation rates, and lastly (perhaps most significantly) achievement gap between various “sub-groups” – again using standardized test results.
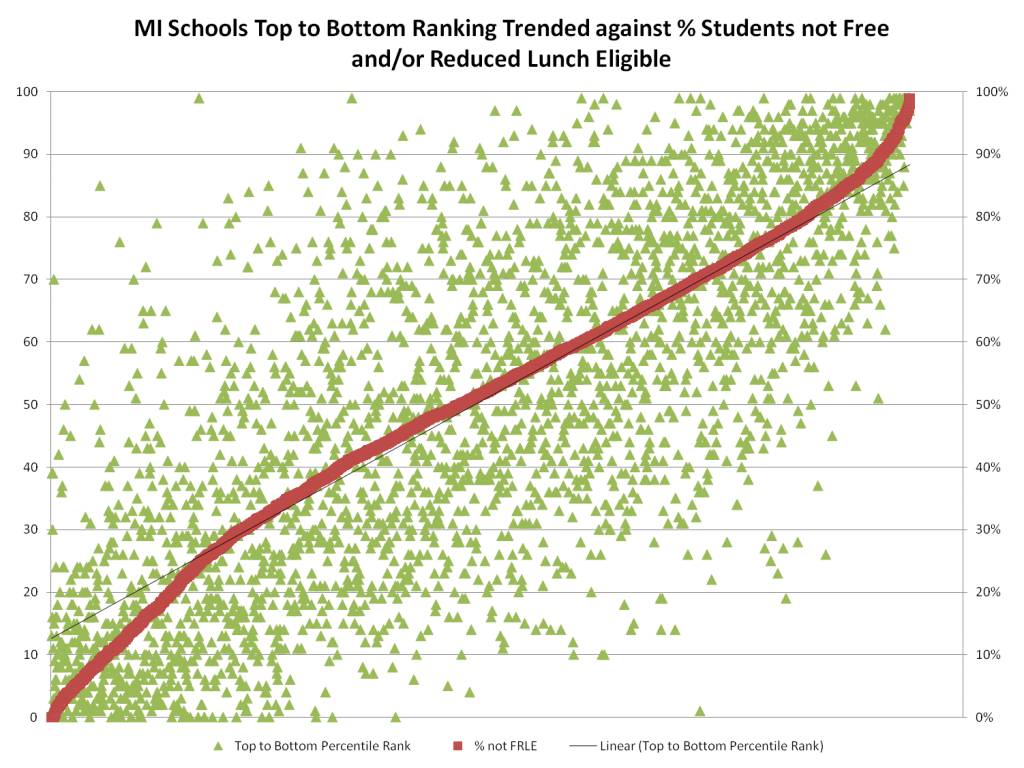
The state stacked up every one of Michigan’s 3,000+ schools and placed them at some percentile. I took those percentile rankings and correlated them to the schools’ Free and Reduced Lunch Enrollment (FRLE) student population.
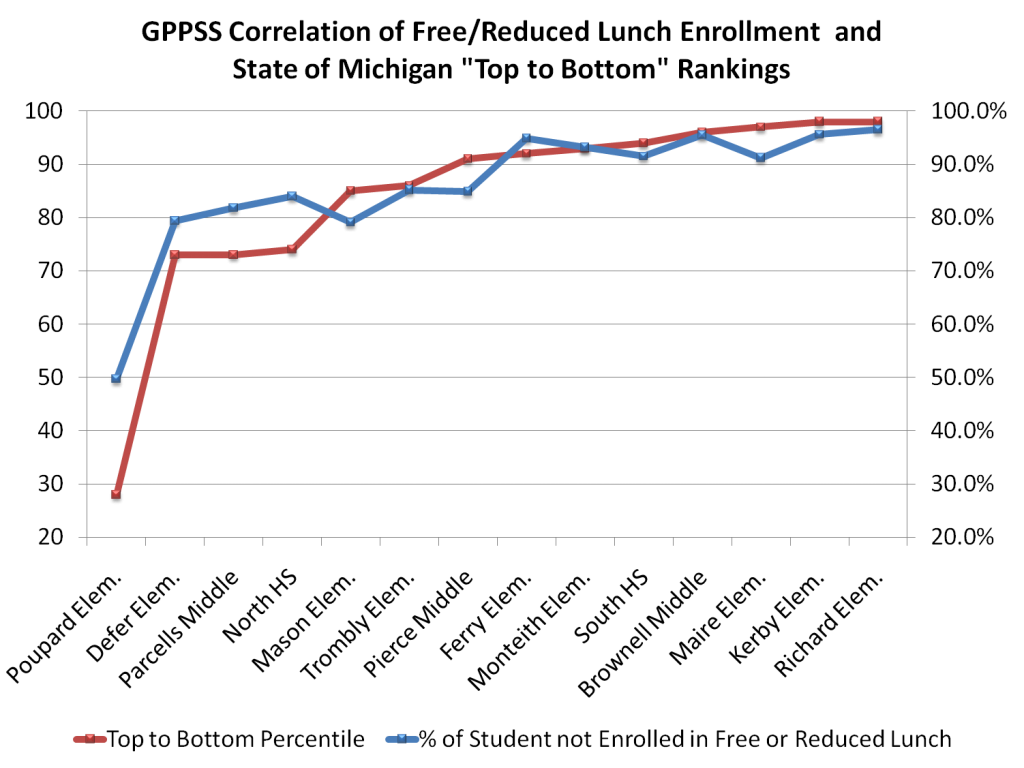
The first view here is just schools in the Grosse Pointe Public School System. Notice the correlation between the percentage of students who qualify (or do not qualify) for FRLE and its percentile ranking in the Top to Bottom list.
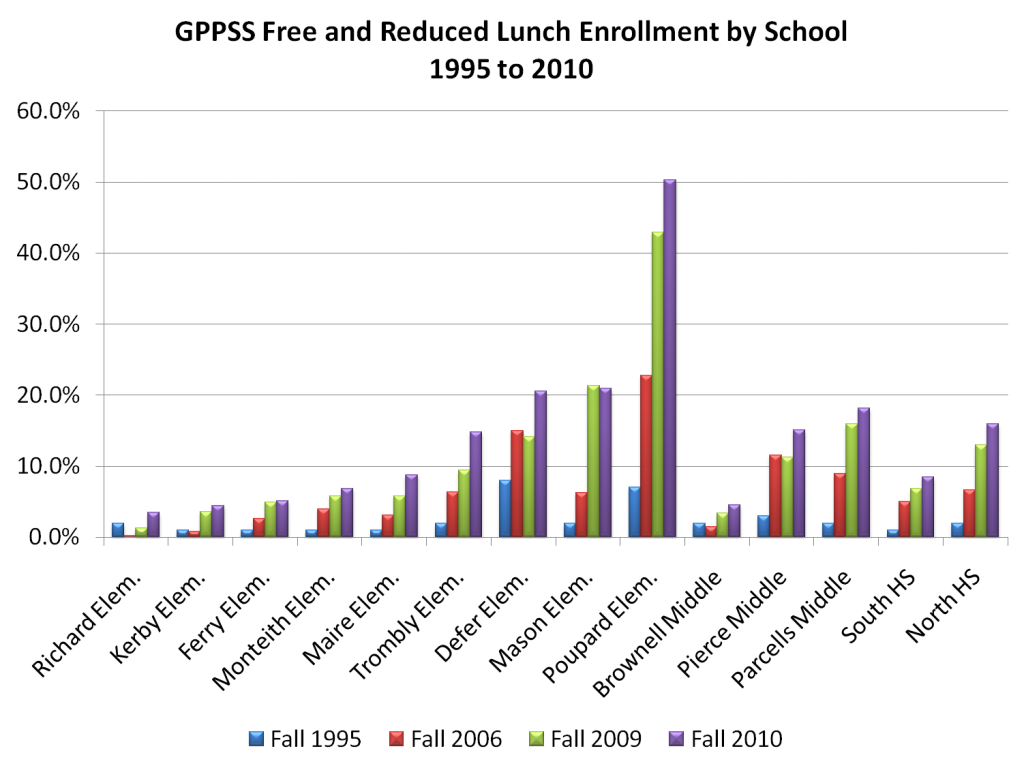
Has it always been this way in Grosse Pointe? Hardly. Look at the dramatic change in our districts SES across all the different schools from 1995 to 2010.
Is Grosse Pointe different in this regard? Judge for yourself where the entire pool of the state’s schools’ Top to Bottom percentile ranking are plotted against their FRLE population. Notice the faint trend line, as if it were needed, to show that the likelihood of being ranked higher in Top to Bottom scales directly in correlation with how many FRLE students you have.
Too often presentation of data like this in misinterpreted as making excuses for poor performance. The education reformers claim the education establishment is using poverty as an excuse. The establishment fires back that the reformers are not accounting for poverty.
In other posts I have gone deeper into this topic, but my greatest interest is to raise awareness to the debate. Both sides acknowledge socioeconomic status is undeniably a factor in standardized test performance. The question then becomes, what now do we do with this information? How do we react?
I would encourage everyone to acknowledge this is an issue for all of us, regardless of where (or whether) your children go to school or where those schools placed in the Top to Bottom rankings.


2 responses to “Free and reduced lunch is a factor from top to bottom”
I am so, SO glad you are on the school board, Mr. Walsh. Please keep doing what you are doing!
Great research job. This study supports what is an already tremendous amount of data that shows that poverty and its associated social and environmental factors is by far the single greatest determinant of school success. Mr. Walsh, as a career educator and graduate of a Michigan high school and university, I salute you! I hope that the NCLB days of demonizing the teacher for academic results are gone, and that state officials will rationally factor in the powerful effects of a student’s home life.