“Doing more with less” was the recurring concern the Board of Education heard from teachers at our last meeting. Who is getting more and who is getting less? What are we measuring? What matters most and to whom? Let’s take a closer look at the dynamics and economics of class size as we wade into murky budget waters.
 In my most recent blog I reported on my trip to the State of Michigan Board of Education meeting where economists delivered testimony on the state budget. Tax policy, specifically the decision to raise taxes, is at the heart of the K-12 funding debate. Let’s call it the tax question.
Governor Granholm and many Democrats argue that taxes should be raised to avoid painful cuts to local school district budgets. They cite statistics that show Michigan’s tax burden is middle of the road in comparison to other states. Senate Majority Leader Mike Bishop and many Republicans argue that whatever the rationale, increased tax burden will worsen Michigan’s already ravaged economy.
The state board put the tax question to economist Patrick Anderson who advised, “Everyone who hires workers and pays taxes thinks [higher taxes] do matter…and they are the ones that really matter.” This position cannot be substantiated irrefutably, but is certainly logical. Indeed, no one argues that increasing taxes is better in and of itself.
The same can be said of class sizes. No one argues that higher class sizes are better. Except in narrow examples (e.g. K-3 class sizes of less than 15 students) research is inconclusive as to whether smaller class sizes improve achievement. To paraphrase Anderson, to the people who matter, higher class sizes DO matter. Students, parents, and teachers prefer smaller class sizes. Supported by research or not, who would not prefer smaller class sizes?
School districts do not publish average class sizes in any consistent manner, but student to teacher ratios are officially tracked and reported by the state. While not the same as class size, it stands to reason that the smaller the ratio of teachers to students the smaller the class sizes. With more teachers and the same number of students, higher staff costs are not offset by per pupil funding. When budgeting, average class size is the most significant variable to quantify since teachers represent the largest segment of employees in any school district.
To set the foundation for this discussion, here is a report I developed to summarize the average class sizes in Grosse Pointe Public Schools as of September, 2009.
[scribd id=23717007 key=key-1efmegb46cg2x5lbapt5]
[scribd id=23717006 key=key-1k3w55uhpxhxirncj02]
Statewide data reveals the ratio of students to teachers is increasing which means class sizes are generally increasing. Here is an extract of statewide data I created to substantiate this claim:
[scribd id=23716244 key=key-24mil9sq8o4a5ldbwcii]
The annual percentage rate (APR) reduction of teachers employed by school districts outpaces the APR of student loss by over 23%. Clearly school districts across Michigan are resorting to higher class sizes in response to their budget challenges. This is not an endorsement of that tactic, but simply a statement of fact.
Let’s take a more narrow view of student to teacher ratio in the Grosse Pointe Public Schools’ Benchmarking report which compares GPPSS key financial metrics against 14 other comparable school districts:
[scribd id=18347939 key=key-sew5jtsbuw8kv5w5wll]
GPPSS’ student to teacher ratio is directly in line with the average of all of the benchmark districts (21:1), yet still lower than the statewide ratio of 23:1. At last month’s Board meeting, teachers raised concerns in public comments about rising class sizes. What are they reacting to? Over the report’s 5-year time period, the GPPSS’ ratio’s rate of increase is over four times greater than the average of the benchmark districts (having moved from 18:1 to 21:1). We find ourselves at a juncture where GPPSS is currently on par with the benchmark districts; however, if we don’t curb that rate of growth we could be at a disadvantage in the eyes of “the people who matter.”
Student to teacher ratio and total teacher compensation are undeniably and inextricably tied to one another.
 What forces create this pressure on the student to teacher ratio? In clinical terms, teachers carry a “cost per unit.” That cost is a combination of salaries and benefits, both subject to collective bargaining. The benchmark report shows that in 2003 GPPSS’ ratio was 18:1 compared to a benchmark group average of 20:1. At that time we held a clear advantage.
At that time, GPPSS teacher salaries averaged $63,219, or 5.7% higher than the average of the benchmark districts. Since then, the APR growth of GPPSS teacher salaries is more than double (5.18%) the average of the benchmark districts (2.09%). The GPPSS average salary margin over the benchmark group average grew from $3,580 to $15,870. As a result, in 2008 the average teacher salary in GPPSS was $85,985, the highest in the state of Michigan, while our 18:1 ratio slipped to 21:1, the same as the benchmark group average. Our “cost per unit” increased at a rate far exceeding our revenue (1.88% APR) and far exceeding that of like districts.
Other factors exacerbate the issue. Retirement (MPSERS) and Social Security costs (FICA) are both established as a percentage of salaries. The higher the salaries, the higher the MPSERS and FICA expenses. For all K-12 school districts across Michigan in 2009-10, the combined percentage of MPSERS (16.94%) and FICA (7.65%) is about 25%. Recalling that $15,870 average teacher margin, the same 25% in GPPSS costs levied against that margin yields an incremental cost of $3,900 per teacher. Add $15,870 to $3,900 then multiply that by 580 teachers and you will see that in Grosse Pointe we carry an incremental cost of $11.46 million that the other benchmark districts do not. Is it any surprise our student to teacher ratio is under greater duress than the benchmark districts?
Let’s also remember that the above numbers don’t factor health care costs. In any investment, the total cost of the investment must serve as the basis of decision. Total compensation is the combination of all costs of employment (salary, MPSERS, FICA, and health benefits). Here’s a summary of the last three years total teacher compensation:
GPPSS Individual Teacher Total Compensation Costs and Staffing Levels (2007-2010)
| 2007-2008 | 2008-2009 | 2009-2010 | |
| Total Compensation | $110,989 | $113,405 | $117,075 |
| Number of Teachers | 602.8 | 603.7 | 579.9 |
Benchmarking and trending common school financial data provides a logical foundation to constructively solve problems and has already delivered proven results in GPPSS.
 This analysis answers some questions, but generates even more, ranging from the practical to the philosophical. One was posed several times at our most recent Board meeting by teachers from Grosse Pointe South who asked, “for how long can we be expected to do more with less?” That depends. What are we measuring. Do we have less teachers? Yes. Are individual teachers getting less? No. Doing the math from the table above tells us that as a district we are getting less, but paying more.
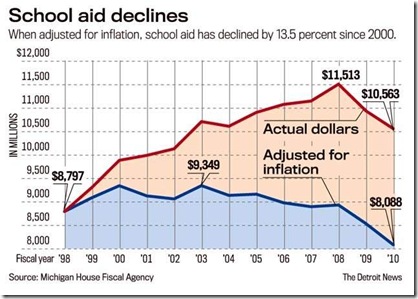
How has this been able to go on? In actuality, Proposal A had historically been able to deliver moderate revenue increases to schools. Since the year 2000, those increases have been outpaced by the rate of inflation (as wonderfully captured in the Detroit News graphic below). But as of October, 2009, with the massive cuts by Lansing to 20J funds and traditional Foundation Allowance aid, what was once a semi-sustainable model is now utterly unsustainable.
With the exception of districts in an actual deficit position, every school district reaches its own financial equilibrium. Investment decisions vary significantly. Contrast GPPSS to the benchmark leader in student to teacher ratio, Bloomfield Hills Schools. Bloomfield receives nearly $4,000 more revenue per pupil than GPPSS yet their average teacher salary is $11,600 less than GPPSS. Let’s look at Administration costs. Bloomfield spent $1,871 per student in this category to GPPSS’ $1,200 per student. Multiplied by our roughly 8,500 students we’re deriving a $5.7 million cost advantage over Bloomfield. Which model is better? These are some of the valuable questions prompted by benchmarking.
Benchmarking has already paid dividends for the district. When I started my Board service four and a half years ago, I extolled the benefits of benchmarking and pointed specifically at one category. At that time GPPSS’ operations and maintenance costs were proportionally millions of dollars higher than state averages. Clearly there was an opportunity there. Our most recent audit shows that in the last 5 years, GPPSS’ operations and maintenance costs have been reduced by $3.27 million annually, largely attributable to the sacrifices made by our custodians and engineers. But without the perspective of benchmarking, we had no standard of measure and didn’t even know what questions to ask.
Speaking as a parent of consumers of the services delivered by our teachers, I could not be happier with those services. I am thankful the district has been able to financially show our appreciation of our teachers for their fine work. But the means by which the state funds public schools does not allow local school districts to translate value judgments to economic reward in an unfettered manner. We must be cognizant of our reality and the new normal with which we are now confronted.
As an individual member of the Board of Education, in response to the questions posed by teachers to the Board, it is a statement of fact that teachers individually have been getting more and have been asked to do more in return. In this equation, parents are the ones who feel they are getting less. Meanwhile, as a district we are definitively getting less from the state, yet our moral obligation is to deliver equal or better services to our students and their families. Collectively we now have the opportunity to take inventory of our condition and our investment options and make decisions that are in everyone’s best interests.
